
While analyzing Forex charts, traders take the help of all kinds of strategies, including technical indicators and patterns, based on what suits them the best. Breakout strategies come with their fair share of risks, however, and approximately 70% of these schemes fail since, in most cases, they are not viable implementations accompanying them.
Breakout trading may seem like a simple affair of buying high and selling low, but the reality is quite different, and if you don’t properly manage your stops, you can suffer huge losses. Read on to find out more.
What are Forex breakouts?
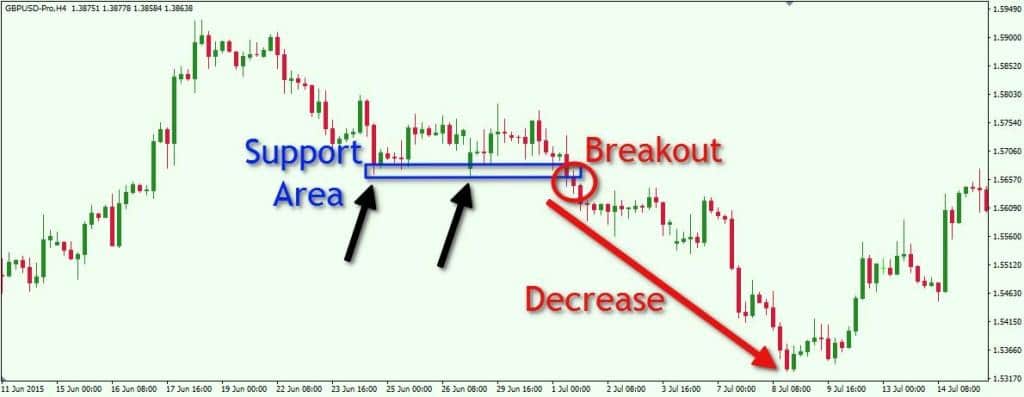
A Forex breakout can be defined as a price shift that is not limited to the area defining support and resistance and has an enhanced volume. The level of the breakout can be diagonal or horizontal based on the price action pattern. Several Forex traders, in order to indicate a breakout, would stand by for the closing price to fix itself beneath support or above resistance.
For instance, take the resistance level of GBP/USD to be 1.67. If, at the end of the trading day, the price is 1.68, we can say that a breakout has taken place.
Why should you go for breakout trading?
Traders go for breakout trading in Forex because of the quality of favorable circumstances it provides. New shifts in the price and trends often occur due to Forex breakouts. As such, traders try to make an entry into the market upon the occurrence of a breakout so that they can cash in quickly on a trend that is potentially materializing.
Furthermore, most of the well-founded breakouts are likely to take place when the momentum is high, and given the quick movements in the price, traders dealing in the price action try to make all the profit they can. Several Forex traders use breakout trading for these reasons.
Identifying breakouts
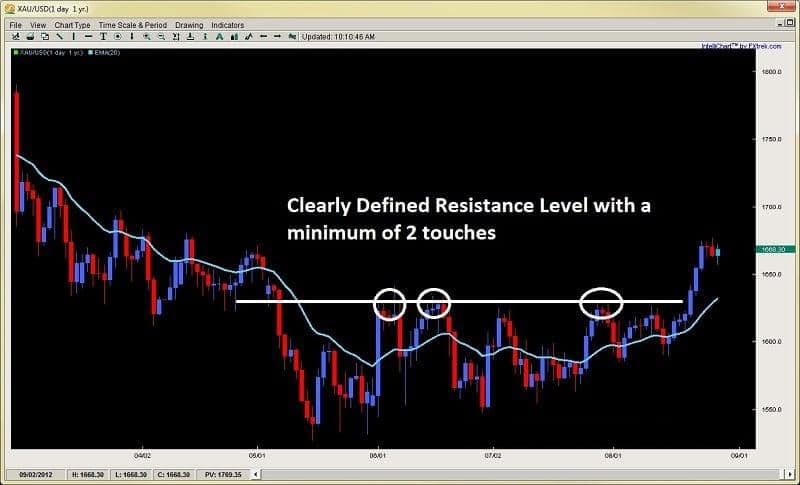
The foremost condition for a breakout is a well-defined resistance or support level, as shown in the figure above. Before defining a breakout, you should make sure there are at least two touches at this level. You should remember, however, that when it comes to identifying a solid breakout, this is not adequate.
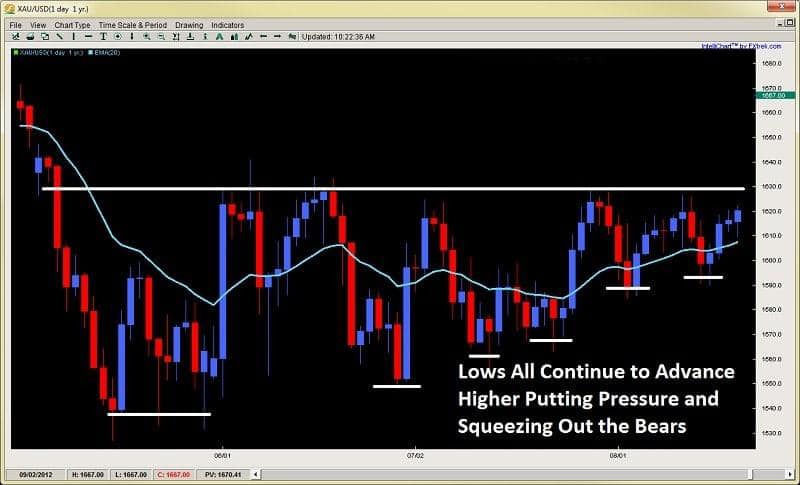
Before a breakout, you need to ensure a pre-breakout squeeze is present. This is extremely vital as it puts some pressure on the bears, who are forced to either make an exit or continue their defense as the bulls start gaining more territory. A squeeze can be easily identified when the price action forms higher lows while tackling resistance and lower highs while tackling support.
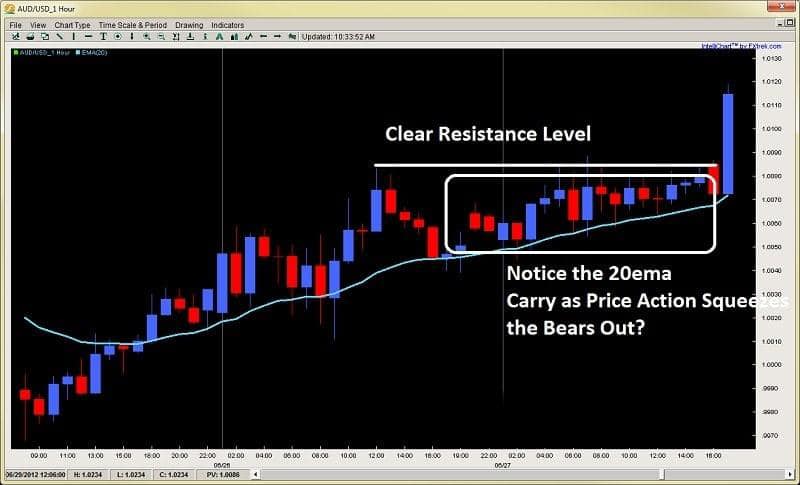
The third pre-breakout signal is the 20ema carry price that leads up to the vital support or resistance level, which visually represents the occurrence of the squeeze phenomenon. Take note of how the 20ema is approached by the rejection, which breaks through after one candle. Several candles can be seen floating right above it as traders start anticipating the breakout and making their entries at the terminal.
MACD
MACD or Moving Average Convergence Divergence is used by traders for assessing rapid changes in the price in order to comprehend the breakout momentum. As the price movements draw closer to the resistance line and break above, a Forex trader can view the rate of change in the prices. Using this indicator, expert traders can identify a breakout prior to the price reaching the resistance line with the currency pair’s acceleration rate acting as a basis.
Moreover, this indicator also tells you when you should close your trading position when the momentum is slowing down, which is a possible indication of the price moving in the opposite direction. When the trader sees the indication for reversal, they often close their positions or place stop-loss orders so that they make the most of the momentum swing.
Bollinger Bands
This indicator consists of three different lines, the SMA for 20 days and two lines parallel to each other that show the standard deviations from the simple moving average. These bands help traders identify extremities in the price that could potentially cause a reversal breakout. With the price moving beyond the outer bands, a reversal breakout is quite probably due to the extreme position of the price.
You can take the help of Bollinger Bands by unlocking a currency pair position when the price moves beyond one of them. You can also use it in combination with RSI and MACD to calculate the breakout momentum. Bollinger Bands allow you to visually represent the prices of currency pairs moving into oversold or overbought conditions.
Relative Strength Index
Relative Strength Index, or RSI, is another indicator that can help you confirm a reversal breakout. Essentially, RSI tells you the gap between higher highs and lower highs for a certain time period. It has some similarities with Moving Average Convergence Divergence since it generates divergences as well, and you can catch the trend reversals by identifying these.
Additionally, you can use RSI to check the oversold or overbought duration of a trend. If the value of the RSI lies above 70, the market is said to be overbought, whereas if it lies beneath 30, it indicates an oversold market.
Since trends are defined as a unidirectional movement for a long time period, the RSI can be seen making forays into oversold/overbought territory based on the trend’s direction. If you see a trend moving back within RSI’s range after having displayed overbought and oversold readings for some time, it is a tell-tale sign of trend reversal.
Closing Thoughts
You should take all the time you need to try out various indicators together in order to identify breakouts. None of them are perfect, and you need to find out a method that works for your particular scenario. With some practice, you can take advantage of breakouts and earn huge gains in the process.