
Developed by Marc Chaikin, the Chaikin Oscillator compares asset volume and prices. It is also commonly referred to as the Volume Accumulation Oscillator. It is the difference between 3-day and 10-day Exponential Moving Averages of the Accumulation Distribution Line indicator. It may be used to validate price movement or divergences in price direction.
With the Chaikin Oscillator, price trends may be confirmed, and potential reversals can be predicted. With this type of knowledge at hand, traders and investors can then take appropriate positions in the market. In essence, it helps in faster decision-making as to whether to go long or short on a particular asset, based on the potential changes in the market momentum.
How it works
Based on trading volume, traders use the Chaikin Oscillator (CO) to gauge the strength of trends.
When this oscillator displays a divergence from the trend, it indicates a lack of confidence in existing trends and the belief that a reversal is imminent.
To calculate CO, subtract a 10-period Exponential Moving Average from a three-period EMA of the Accumulation Distribution Line (ADL) indicator.
Using a ten-period Moving Average of asset prices and a three-period Moving Average of the freshly created ADL’s value, the CO is the difference between these two Moving Averages.
This indicates that the ADL line is at a low value compared to the asset price, which shows that selling pressure is building and that the asset’s price reversal is impending. A decrease in the Oscillator value indicates a diminishing purchasing pressure and a price rise.
Therefore, it is possible to identify when to sell or buy an asset to take advantage of (or prevent) the impending reversal by employing the CO indicator.
The fundamentals of CO indicator
Chaikin contends that the oscillator has a three-pronged foundation. Assumptions are that:
- If the final price was more significant than its midrange for the day, there was an accumulation. The higher the amount of money invested, the closer an asset is to the all-time high. When an asset price closes at a level lower than its midpoint for the day, it indicates a distribution. In general, the closer an asset came to its low point, the greater the distribution amount.
- A strong gain is likely following a rise in volume and an accompanying significant buildup of volume. Put another way, lagged volume on rallies suggests that there is less momentum available to push prices higher.
- This indicator allows you to keep track of the amount of volume that enters and exits a market at any one time. Comparing this flow to the price movement for short-term and intermediate-term analysis helps identify bottoms and tops.
Trading strategies
CO and divergence
A divergence occurs when the currency price is moving in one direction while the CO indicator is trending in another. For traders, a divergence indicates a weakening of the asset’s price, suggesting a possible reversal. Divergence can be positive or negative, depending on the direction it takes.
This indicates that the uptrend is waning if the oscillator doesn’t follow the price to new highs. In addition, a price reversal is expected soon. The bearish divergence is what traders call this.
As long as the price continues to strike lower lows, while the indicator makes higher lows or moves sideways, the downtrend will continue to lose strength, and the price will retrace its losses. When this happens, it’s referred to as a “bullish divergence.”
Price action trading
In the chart below, you can see the price movement of the EURUSD pair. At point A on the bottom part, the oscillator shows growing volume momentum as it crosses the zero mark. To validate this buy signal, look at the price movement that began in the upper area of the chart at the corresponding number one.
At point B an oscillator shows that peak-to-peak changes follow two dips in weight. This is a sell signal, as seen by the decrease at point B.
A strong buy signal can be seen at point C when the oscillator is again coming from the bottom and crossing through the zero line.
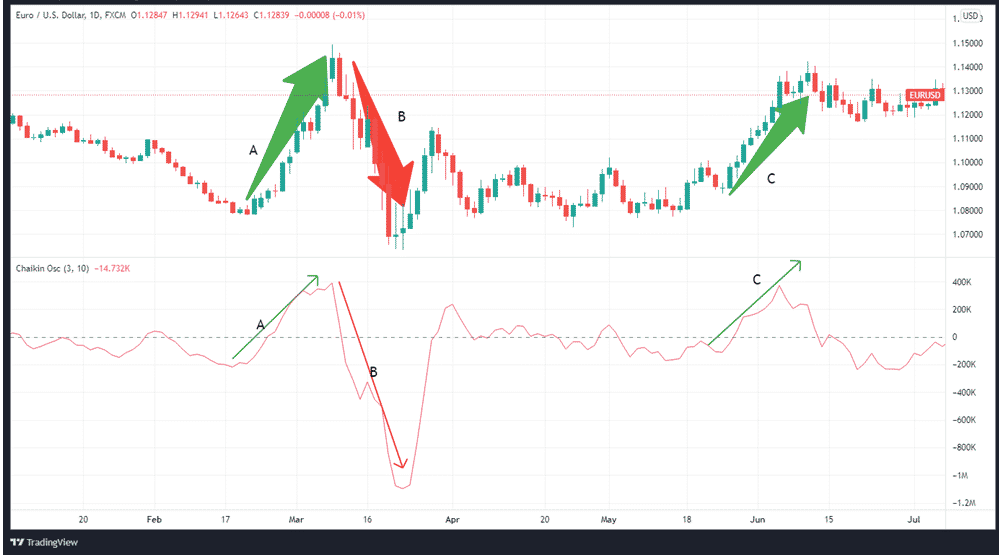
Although the oscillator drops quickly following the three-peak sequence at point C, the actual price drop is not as severe as the oscillator predicts.
Advantages and disadvantages of the Chaikin Oscillator
Advantages
- Indicator response time is quick.
- It may be used in combination with other oscillators.
- It does not redraw the values it contains.
Disadvantages
- You must use it in combination with other indicators to filter out the frequent false alarms.
- The indicator’s extreme flexibility might confuse both novice and seasoned traders alike.
In summary
The Chaikin oscillator’s signals may be used as a basis for a successful trading plan. To leverage an impending reversal, traders may utilize the oscillator indicator to estimate the optimum timing to either sell or purchase an asset. However, it has its drawbacks and might, like any other method of technical analysis, provide false readings from time to time.