Of the many things you need to make a great forex trader, an analytical mind is the best gift. Technical analysis tools often accompany the objective view of the market. However, technical tools on their own are not sufficient to ensure success. This is the point when techniques such as pivot points come in handy.
As you climb up the expertise ladder in forex trading, you begin to notice that flexibility matters more than mastery of specific technical tools. Pivot strategies add flair to your trade setups; to put you a step ahead of the curve. This article outlines how pivot point strategies used alongside common technical indicators are a recipe for forex success.
Pivot points: an introduction
Pivot points indicate the precise moment when market sentiment shifts from one orientation to another, i.e., from positive to negative or the other way round. Market sentiment refers to the tone or feeling toward a specific currency in the forex market.
However, market sentiment is intangible, which means we can only perceive it by observing traders’ activities in the market. The best way to observe the “crowd psychology” is through tracking price action over time. For instance, falling prices would indicate a negative market sentiment, while rising prices would indicate a positive market sentiment.
It is not enough to know if the market sentiment is positive or negative. Instead, investors want to know when the shift happened. The best thing about pivot points (PP) is that they indicate critical support and resistance levels from a purely mathematical perspective. As such, an investor can anticipate trend reversals with better accuracy using the information.
A detailed explanation of pivot points
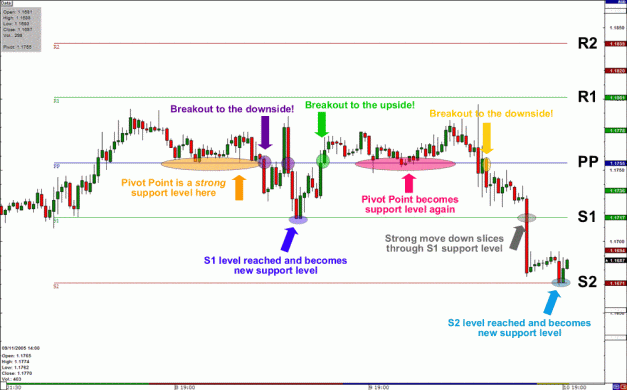
Figure 1 shows a pivot point (PP) superimposed on a price chart. There are two lines on either side of the PP, where the lines on the upper side indicate potential resistance levels, i.e., R1 and R2, while the lines on the lower side indicate potential support levels, i.e., S1 and S2.

Figure 1: Pivot points also act as support/resistance levels
At the beginning of the day, the PP offered a strong support level, but a breakout to the downside happened a few hours later. The price action then tested the S1 support level before recovering past the PP level. Towards the end of the day, the price action swings down and tests the S2 support level.
So far, you will notice that the pivot points appear almost similar to Fibonacci levels. Also, notice the usage of specific terminologies, such as PP, S1, and so on. We will explain the terminologies when illustrating how to calculate pivot points, and we will distinguish Fibonacci levels from pivot points at a later stage.
The math behind pivot points
The best thing about forex pivot points is objectivity. Unlike other indicators where you choose arbitrary prices, the pivot points use existing prices, i.e., the previous day’s high, low, and closing prices. We can find pivot points by averaging out the high, low, and closing prices of the previous 24-hours of trading.
The following formula helps to calculate the pivot point (PP). Notice the line labeled PP in figure 1 above.

After evaluating the pivot point, now go on and find the resistance and support levels. Let us begin with the support levels:


Next, evaluate the resistance levels:


When plotted on a price chart, the indicator appears as in figure 1. If you look at the indicator keenly, you might easily mistake it for Fibonacci retracements. But as earlier noted, pivot points offer a more objective view of the market sentiment.
On the contrary, traders choose arbitrary swing low and swing high price points when using Fibonacci retracements. This introduces an element of bias, which increases the chances for a flawed reading of price action and market sentiment.
Putting pivot points into practice
Traders calculate PPs to help predict the next day’s high and low prices. However, it is worth noting that pivot points are more useful in a trending market. Notice how the price rebounds from supports and resistances that are derived from the previous day’s numbers.
Most traders use pivot points to find reasonable prices at which to enter or exit market positions. However, the odds of making the right bet are slimmer when the market is ranging. Middle-of-the-run markets can go either way, and there is no telling with certainty where that direction will be.
Fortunately, you can throw in other indicators like RSI or MACD for more precise directions. Let us consider the H1 EURUSD price chart below to illustrate how this works.
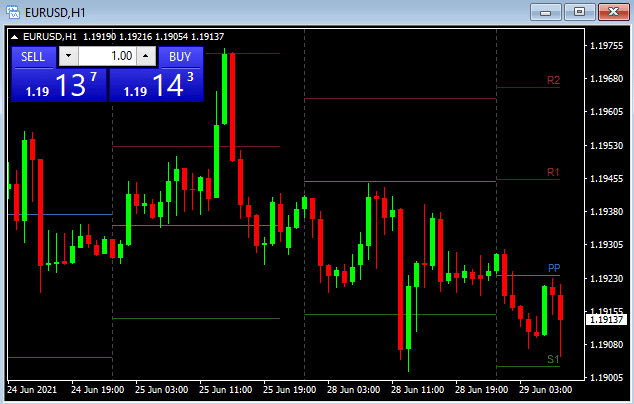
Often, day traders wait for the price to reach S1 or R1 levels before making a decision. In figure 2 below, the market is not convincing as to whether it will continue to S1 or backtrack to PP. Such a market is in the middle of a run, which complicates the reliability of the pivot points.

Figure 2: EURUSD H1 price chart
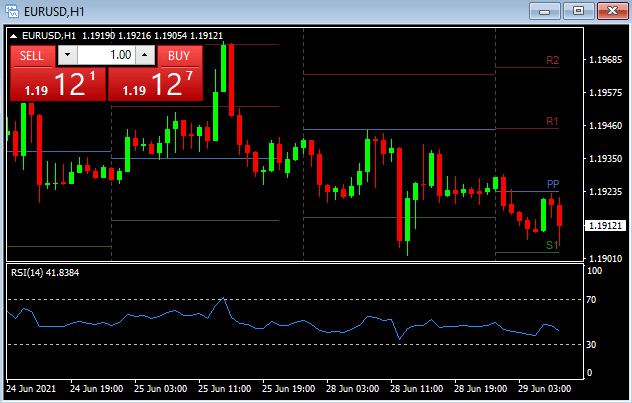
Instead of taking an irresponsible risk, it helps to try and refine the setup before making the last plunge. In this case, we will add one more indicator, probably an oscillator such as RSI. The RSI indicates a bias on the bearish side, which means the price action is more likely to push downwards than backtracking to the PP level.

Figure 3: H1 EURUSD price chart with RSI
With this knowledge, we now have a clear idea of what the market would look like in the coming hours. Therefore, the 1.19121 level is a great market entry point, but with an eye on the PP level (or 1.19235) as the critical resistance level. The PP level is also an ideal point to place a stop-loss order for risk management.
Final words
This article restricted its analysis to the standard pivot point’s technique. The formula used herein dates back to the pre-computerized forex trading era. Over time, experts developed more advanced pivot point techniques that incorporated other indicators.
Some advanced techniques include Fibonacci pivot points – the formula of which is based on Fibonacci retracements, and DeMark Pivot Points – a technique that modifies the base pivot point.
