Price action is an integral part of technical analysis. The oscillations that come about the result in unique chart patterns, thus making it easy to identify ideal entry points, profit target levels, and areas to place a stop loss. Measured move down is a formation for anyone looking to take advantage of markets in a downtrend.
Measured move down: the psychology
The measured move-down pattern occurs when a currency pair is trending lower. It is characterized by two impulses that are of the same size and take almost the same amount of time to form. Additionally, there is usually a corrective phase between the two impulses that is usually small, signaling a period of the market correction.
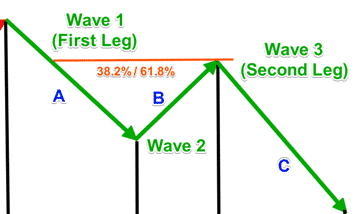
The image below clearly shows prices trending lower in the first leg, affirming short sellers in control.

However, price appears to have hit a critical support level whereby exhaustion kicks in. The exhaustion comes in the form of market participants taking profits. The consolidation that comes about signals waning short-selling pressure resulting in wave 2 with price edging higher slightly.
The correction occurs in a tight range. In addition, the consolidation provides an opportunity for traders who had missed out on the previous leg lower to enter a short position as soon as the price bounces. The bounce-back makes it easy to sell slightly high.
The measured move pattern is affirmed by wave 2, the bounce back from the lower lows, not retracing more than 61.8% of the previous leg low. The bounce-back should be small and short-lived to affirm that the market is still in a downtrend. If the retracement is more than 61.8%, the likelihood of price edging down is lower after consolidation.
The image above shows that the retracement is less than 61.8%, after which the price edged lower, forming the second leg or wave 3.
Things to remember
In most cases, wave 1 and wave 3 are usually of the same amount of pips or height for the measured move-down pattern to hold. Conversely, short sellers measure the number of pips of the height of wave 1 and extrapolate it at the end of wave 2, to see where the price is likely to end as part of wave 3.
It is also expected that the amount of time it takes for wave 1 to form will also be the same amount of time that it will take for price edge lower as part of wave 3 formations.
Another thing to remember is that the correction as part of wave 2 should always be less than 61.8% of wave 1 to affirm the market is still bearish and that bulls have not assumed control.
How to trade measured move down
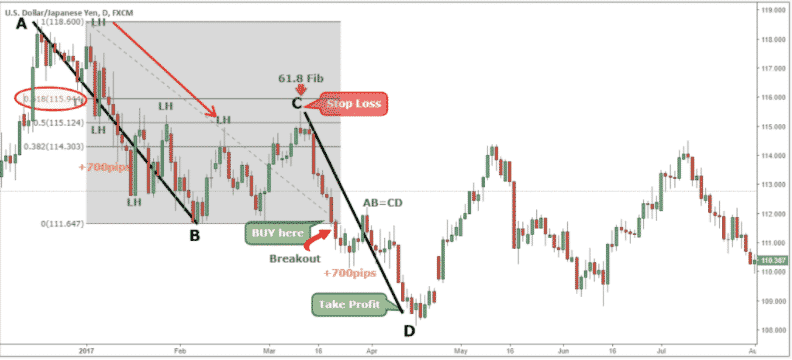
The USDJPY chart clearly shows the formation of a measured move-down pattern. wave 1 is characterized by price moving from point A to point B making lower lows.

The move from point A to B signals short sellers are in control. Once the downtrend has been ascertained, traders who missed out on the lower leg can look to trigger a short position as soon as USDJPY enters a corrective phase.
The corrective phase starts with price bouncing off point B upon hitting a critical support level. The following bounce-back results in USDJPY making higher highs but in a tight trading range. The retracement, however, does not exceed 61.8%, affirming that short sellers are still in control despite price edging higher from point B
The formation of a strong bearish candlestick at point C affirms that bulls have been overpowered and that bears have resumed control. The prospect of price edging lower from this level is usually high as part of the measured move-down pattern.
Entry points
Aggressive traders who missed out on the initial leg lower as part of wave 1 (A-B) can look to enter short positions as soon as the price pulls back from point C with the formation of a strong bearish candlestick. By triggering a short position close to the point, one gets to ride the entire wave as the price would often move almost the same amount of pips registered in the first wave.
However, by triggering a short position close to point C, one also exposes themselves to the support level at point B, whereby price can fail to break out. Given that price can bounce off this level and start to move higher, calls for extreme caution.
Consequently, instead of entering a short position near point C where one is not sure that price will break through the previous support, one can wait for a break out at the support. Once price breaks out of the support level, then one can look to enter a sell position to ride the entire wave down.
Take profit rules
Regardless of where one enters the short position as part of the third wave, the take profit level will always be the same. This is because wave 3 (C-D) is expected to be the same amount of pips or height as wave 1 (A-B) when extrapolated from point C.

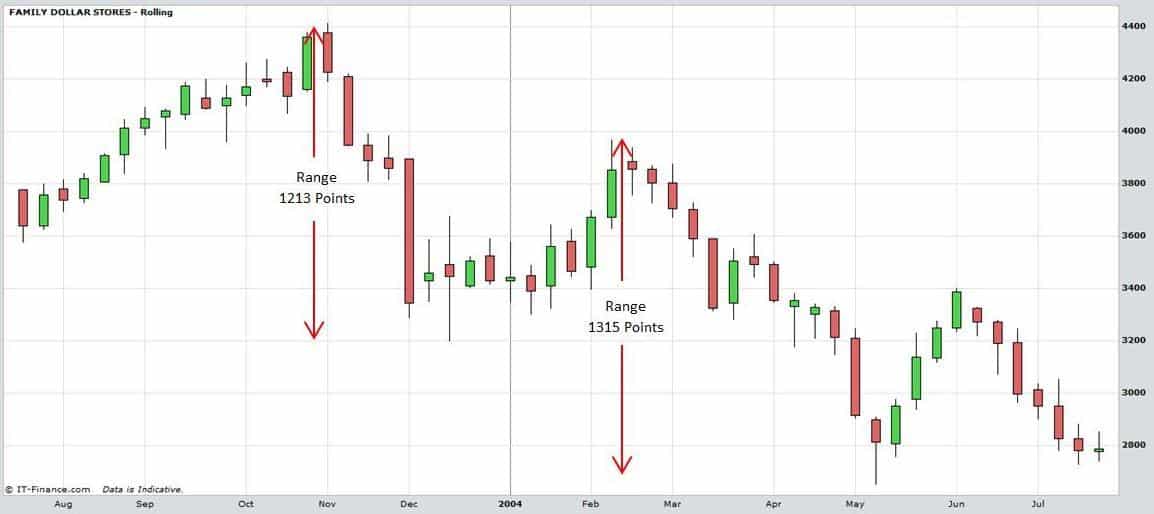
Conversely, if the price moved lower 1213 pips in the first wave, as is the case in the chart above, it is expected that it will also move the same amount of pips once it starts edging lower after the corrective phase.
Stop Loss
It is important to use a stop-loss order as reversals can always occur when a measured move-down pattern appears to be in play. For traders who enter short positions near the pivot at point C, then their stop loss can be a few pips above point C to mitigate against price bouncing back and edging higher instead of lower.
For traders who enter a short position after the price has broken out of previous support at point B, then their stop loss can be a few pips above the support at level B, which in this case can be in the middle of wave BC.
Conclusion
The measured move-down pattern works best in markets that are trending lower as it affirms the likelihood of price edging lower once bulls are overpowered after a short-term pullback. The pattern has a high risk-reward ratio given its well-defined entry and exit levels as well as ideal places to place a stop loss. It can also be deployed in any time frame.
