While the markets are perceived as completely random, some experienced traders must have noticed that certain patterns emerge offering some sort of price movements’ predictability.
This is fairly intuitive when it comes to the trading pattern of assets that have underlying macroeconomic factors, such as commodities and currencies. When these patterns show repetition over the yearly cycle, it’s termed as seasonality in market parlance.
Some of the examples of seasonality have underlying causality. For example, the demand for heating oil rises across the globe during winters, which subsequently impacts the commodity’s price. Other examples of seasonality are simply observations and don’t have any underlying cause as such.
A clear way to analyze past price behavior is to examine the price activity itself without the noise of indicators. When we examine prices in isolation, seasonality patterns often emerge. Seasonality is a predictable change that repeats every year at the same period.
There are no guarantees that historical patterns will repeat themselves, but whenever a pattern has been repeated 80% to 90% of the time, it becomes statistically significant—and that is valuable information for traders.
EUR/USD seasonality
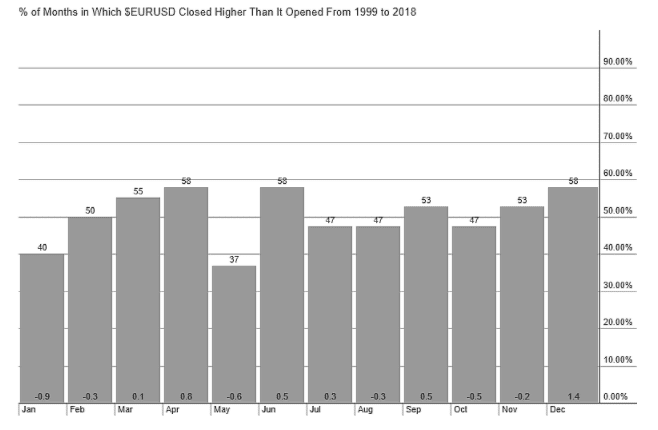
Let us take the example of the seasonality in EUR/USD observed in the month of December. The histogram below shows the direction of the monthly change in EUR/USD in terms of percentage for the years 1999 to 2018.

Just to illustrate the data, take the bar of September that says 53. What it means is that in these 19 years, EUR/USD closed higher 53% of the time. The number at the bottom of the bar further shows the average percentage move.
In September, EUR/USD moved higher by 0.5% on average. As you can see, there are three tall bars in this chart – April, June, and December. For each of these months, the EUR/USD pair has closed higher 58% of the time. This gives the traders a statistical edge as they know that in the absence of any new information, it is more probable that EUR/USD will close higher rather than lower.
USD/JPY seasonality
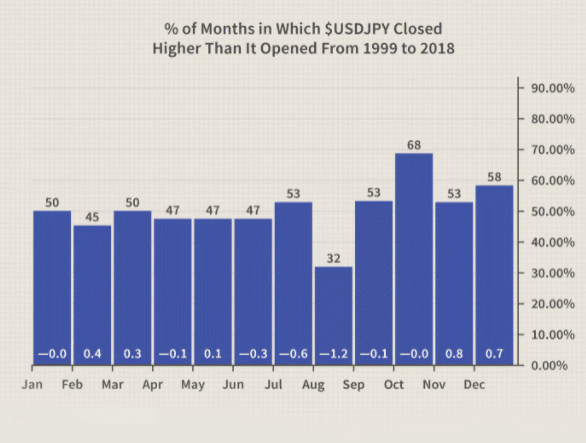
Let us take another example where the seasonality trend is much stronger and palpable. Here is an example of the USD/JPY’s strength during the month of October. As you can see below, the bar for October clearly stands out with a hit ratio of 68%.

This means that USD/JPY has closed a higher a whopping 68% of times in these 20 years. Another interesting thing to note would be that the average change in USD/JPY is zero, as seen at the bottom of the bar. What explains this seemingly contradictory piece of data? It implies two things.
One is that of the 32% that the USD/JPY closed lower in these 20 years, the price move was much sharper. That means the average down move was much higher than the average up move.
Secondly, the up move wasn’t strong consistently, which gave us the lower up move on average. This particular USD/JPY seasonality is popular even among large institutional traders of the big banks like Goldman Sachs and JP Morgan.
So despite large players being aware of this seasonality, it continues to remain strong, implying that there might be a strong underlying macroeconomic factor that is driving the move. Hence, despite large players trading on this strategy, it hasn’t been arbitraged away yet!
GBP/USD seasonality
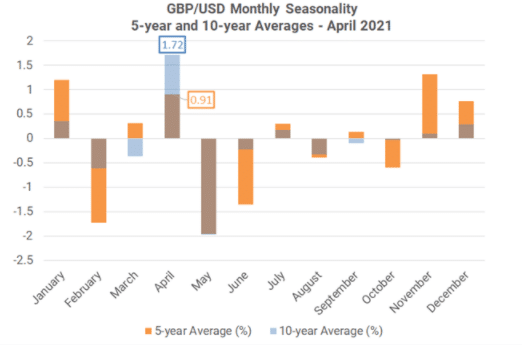
Finally, let’s take the example of GBP seasonality in April. April is a very bullish month for GBP/USD, from a seasonality perspective.
Over the past 5-years, it has been the third-best month of the year for the pair, averaging a gain of +0.91%. Over the past 10-years, it has been the best month of the year, averaging a gain of +1.72%.
As you might have noticed, the below chart is slightly different from the previous two. Instead of analyzing the hit ratio, the number of times GBP/USD closed higher over the past few years. The chart focuses on the returns on two different benchmark periods – five years and ten years. This helps us understand that seasonality has worked both over the short term and the long term.

Seasonality doesn’t necessarily have to be yearly. A monthly or even a weekly seasonality is not uncommon. It all depends on the underlying causality.
For example, many firms attempt to reconcile and settle their trades at the expiry days of futures contracts making these days especially volatile. This gives rise to seasonalities that happen on specific days or months repeatedly across years.
The takeaway for FX traders
As traders, there are many ways that you can apply the knowledge of seasonality to improve your trading. For example, suppose you are trading the GBP/USD in September as a long-term trader. In that case, you can look for opportunities using fundamentals or technicals to buy the GBP/USD – aligned with the seasonal trend direction.
As a short-term trader, you can reduce your holding period if you are taking a trade that is against the seasonal trend, or, like longer-term traders, you can focus on primarily looking for long GBP/USD trades. Although seasonal patterns do not duplicate themselves 100% of the time, following seasonality rather than fading it may improve your ability to find high probability trades.
The important factor to remember here is that seasonality is only a statistical tool to aid in better decision-making for the FX trader. It can help you avoid mistakes identifying and interpreting chart patterns. Seasonality itself shouldn’t be used as the basis of a strategy, often given it might not even have an underlying causality.
