Moving Averages or Mas identify support and resistance levels that are generated by the price action of pre-defined cycle lengths and turn lower or higher in response to broad trends. You can learn about exponential moving averages (EMAs) and simple moving averages (SMAs) to trade better.
What is Moving Average?
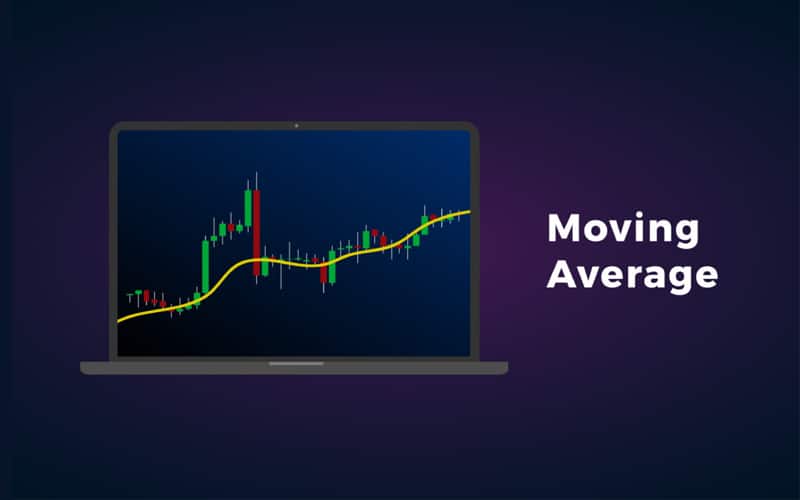
The moving averages or MA is a simple technical analysis tool that creates a constantly updated average price and levels out price data by doing that. To do this, the indicator filters out the “noise” from short-term price fluctuations. Traders can choose the moving averages for any timeframe, like minutes, days, weeks, or any other period of time the trader wants. It is advantageous to use moving averages in trading, and there are many types to choose from.
The fact that this indicator goes with any timeframe is also a great benefit because traders can use it for both long-term and short-term trading. It is most commonly used to identify trend direction so traders can determine support and resistance levels. When asset prices cross over the moving averages, a trading signal may be generated for technical traders. Moving averages are useful on their own, but they are also used with other technical indicators like the MACD (Moving Average Convergence Divergence). There are many strategies that use this indicator. Keep in mind that the associated strategies, as well as moving averages itself, work best in strongly trended markets.
Moving Averages history
The moving average was used for decades to smooth out data points. The history goes way back to 1901. However, the name was applied by Jeff Miller later. G.U Yule described it as “Instantaneous averages” in the Journal of the Royal Statistical Society in 1909. We can find it again in W.I. King’s book “King’s Elements of Statistical Method” in 1912. H. Wold referred to the term “Moving Average” as a type of stochastic process in his book “A Study in the Analysis of Stationary Time Series” in 1938.

The detailed description of “Exponential Smoothing” comes from StarSoft Inc. that expressed it one of the many techniques to weigh past data differently. In 1957, Holt published his paper on Moving averages, “Forecasting Seasonals and Trends by Exponentially Weighted Moving Averages”. P.N. Haurlan was the first that used exponential smoothing to track stock prices. He called them “Trend Values”. What he referred to as a “10% Trend”, we know as a 19-day EMA now. His terminology was the original for use in stock price tracking. So, traders use that terminology to this day. Today, moving averages is one of the most popular indicators that most traders use in trading.
Short and Long term Moving Averages
Price above rising short and long-term averages generate bullish convergence and it favors long-term strategies due to longer holding periods and bigger positions. This technical alignment is common in bull markets and uptrends. On the contrary, the price below rising short and long-term averages generates the bullish divergence favoring value plays and dip-buying opportunities. When price trades above averages with opposite slopes, it signals conflict. A rising long-term average supports the long-side plays with a falling slope pointing to the higher-risk environment.
Similarly, when the price falls below a long and short-term average, it generates a bearing convergence that supports short-sale strategies and encourages longer holding periods and bigger positions. This technical alignment is common in bear markets and downtrends. A bearing divergence is generated by the price above falling long and short term averages. In this scenario, price trading below averages with opposing slopes indicates a conflict. You can see a falling long-term average that supports sell-side plays with a rising slope warning of an impending bottom.
From these scenarios, you can experience a small portion of the complex interrelationships among moving averages, slope, and price. You should welcome conflicts because interweaving price structures generate powerful engines for long and short-term trading opportunities. However, you need to be careful when moving averages ease into the horizontal orientation and coverage, and the price oscillates across the narrow levels. The mixed action may point to high noise levels and it can signal long periods of weak opportunity. In sideways markets, moving averages ease into horizontal trajectories and lower their value in trade and investment decision making. To use the indicator the right way, you need to learn about all these features so you can make the best use of it.

Top Strategies based on Moving Averages
Moving Average Envelopes trading strategy:
Moving average envelopes refer to percentage-based envelopes that are set above and below of moving averages. You should test our different percentages, currency pairs, and time intervals to understand how you can apply an envelope strategy the best way. Most commonly, you can see envelopes over 10 to 100 days periods while using bands that are distant from the moving average of 1 to 10% in daily charts.
The envelopes are often much lesser than 1% in day trading. You can change the settings from day to day according to volatility. The right time to trade is when you can see a strong overall directional bias of the price. In an uptrend, you can buy when the price approaches the middle-band and then rallies off of it. Similarly, in a downtrend, you can short when the price drops away from the middle-band after approaching it.
Moving Average Ribbon trading strategy:
You can use the moving average ribbon to create a basic forex trading strategy that is based on a slow transition of a trend change. Eight to fifteen exponential moving averages form the ribbon. The resulting averages provide an indication of both the strength and direction of the trend. A steeper angle of the averages with greater separation between them causes the ribbon to widen and thus, indicates a strong trend. Traditional buy or sell signals are the same types of crossover signals that you can use with other moving average strategies. It involves numerous crossovers. So, you must choose how many crossovers you need for a good trading signal.
The Conclusion
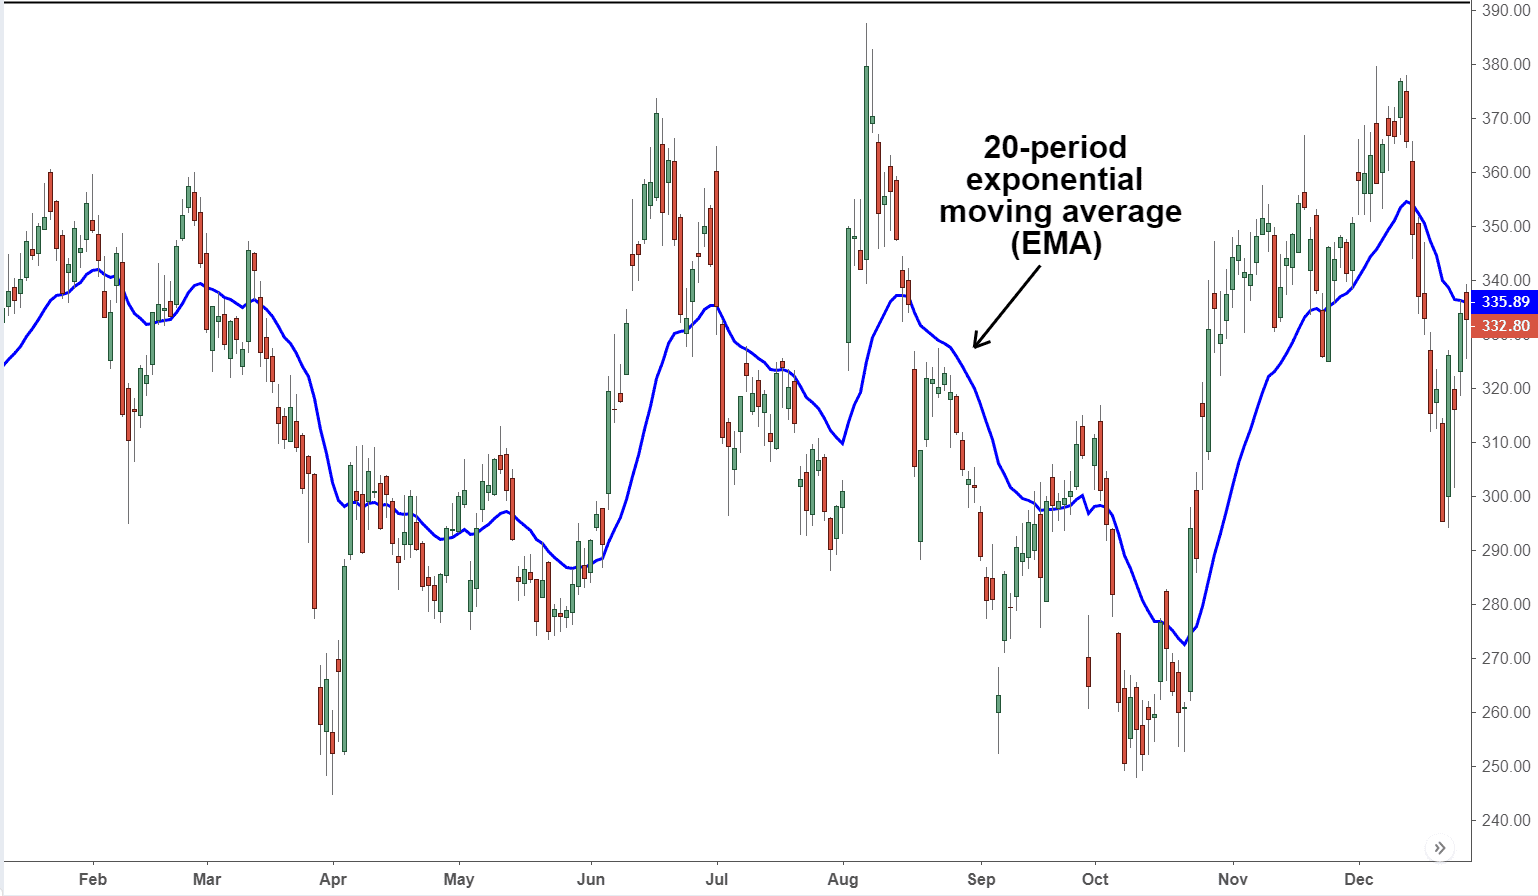
The moving averages smooth out price data and create flowing lines to simplify price data. So, traders can see the trend easier. Compared to simple moving averages, exponential moving averages react to price changes quicker. In some cases, it generates good results and sometimes it causes false signals. If you opt for a shorter lookback period, for example, 20 days, then Moving Averages respond quicker to price changes than a longer lookback period like 200 days.
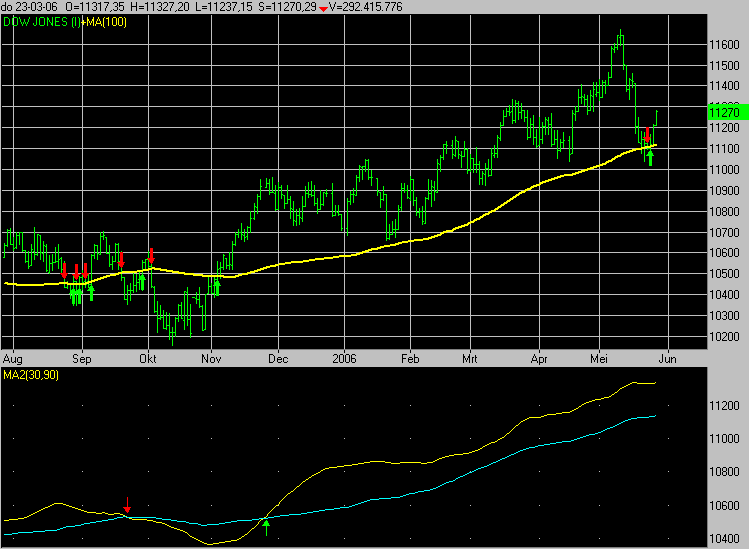
You can use a moving average crossover strategy for both entries and exits. It also highlights areas of potential support and resistance. Keep in mind that it seems predictive, but moving averages are based on historical data and displays the average price over a certain period.
