For novice traders, volume is an overly complex aspect of trading, and many of them don’t bother taking it into account. On each active market day, a particular pair might be traded, but the volume of trade varies from day to day.
The On Balance Volume (OBV) indicator allows you to trade volume efficiently by calculating it in a lesser amount of time.
What is the OBV indicator?
It is an indicator that forecasts price movements by measuring the shifts in volume. This measurement is done on the basis of the theory that when the trading volume changes, a noticeable price movement always occurs.
For instance, when several merchants invest in a pair, it increases the trading volume, pushing the price higher.
When the price rises, the OBV line follows suit, and when it falls, OBV also experiences a dip. When there is a sharp movement in the indicator, you know that major players are entering the scene. When the movement is relatively smooth, you know there are regular traders making their entries.
This indicator also depicts the general trading tendency of major players, thus forecasting an upward or downward momentum.

However, the strength of the price shift is not considered by it. Traders mostly use it in trending markets to point out the signals indicating the persistence of the trend and pivot points.
How to read it?
Market experts assume that OBV shifts are followed by price shifts. Since the main driving force of the market is the volume, the indicator can be used to forecast major movements.
When OBV rises, the pair accumulates smart funds, and when traders start to invest in it, both the pair’s price and the OBV will go up.
The actual value of the indicator holds no statistical relevance. There are certain speculations about this indicator, such as:
- When OBV reaches a new peak, it tells you that purchasers have more power compared to sellers and that the price will probably go up.
- When it reaches a new low, you get the indication that sellers hold power compared to purchasers and that the price will probably fall.
- The presence of a primary trend is confirmed when the OBV rises and falls with the pair’s price.
- If the OBV shift is preceded by the price, it is a signal of a divergence.
OBV feedback system
Several individuals use this indicator for measuring the likelihood of breakdowns and breakouts since it provides feedback for testing major peaks and troughs. This is an uncomplicated procedure where the price action is compared to OBV’s progress, and the divergence and convergence associations are noted.
The main forecasts that can be made are:
- When a new peak is reached by OBV and the resistance is tested by the price, it signals an upward divergence. This means the resistance level will be broken by the price that will rise even higher.
- A new peak is attained by the price as the indicator hovers around the preceding level of resistance. This signals a downward divergence, forecasting the reversal or pause of a rally.
- A bearish divergence is signaled by the price testing support and OBV hitting a new trough. This means that the support level will be broken by the price and that it will persist in its downward movement.
- When the price action is matched by the indicator, an upward or downward convergence is indicated.
- When a new trough is reached by the price as the OBV hovers around the ultimate support level, it is an indication of bullish divergence.
How to trade using OBV
Both upward and downward divergences can signal a price reversal to traders. As a general rule, you should follow the indicator’s direction and place your trades accordingly.
Usually, you need to look out for divergences while using the OBV indicator.

Both upward and downward divergences can signal a price reversal for traders. As a general rule, you should follow the indicator’s direction and place your trades accordingly. Usually, you need to look out for divergences while using the OBV indicator.
These take place when the indicator fails to confirm the price shifts, signaling a looming reversal. Unlike Relative Strength Index or Commodity Channel Index, the divergence between OBV and price is not a rare occurrence. Its frequency is relatively high, although the usefulness depends on whether you are using it in combination with price action and other indicators.
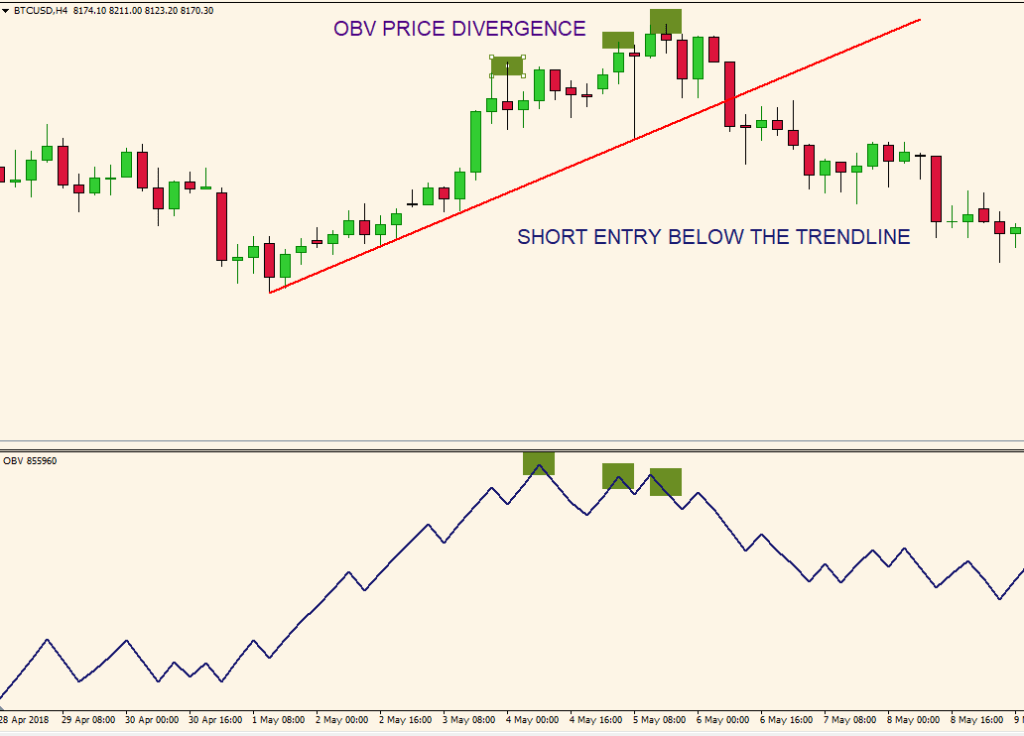
In the above chart, we see the indicator reaching lower highs, while higher highs are being made by the price. This tells you that there is a chance of the price reversing. Prudent traders cannot base their short entry on divergence only.
Other indicators and tools should be used for entry confirmation. Here, the closure of the price beneath the bottom trend line of the upward channel is considered as a legit indication, and after the price closes beneath the trend line, you ought to take a sell position.

After the breakage of the trend line, a downward momentum was noticed, and confirmation was received in the form of an OBV shift.
OBV trend reversal
When there is a bullish trend and the OBV depicts a downward divergence, it is wise to go short once the present trendline is broken below the price line.
A good place to place your stop-loss is just above the most current swing. You can choose to hold your position if it is confirmed by OBV and if the price trends downward approaching the support level.
During a bearish trend, if an upward divergence is exhibited by OBV, trades tend to go long when the present trendline is broken above by the price. Here, you should place stop-loss beneath the most current swing.
Conclusion
The OBV indicator is great for anticipating major price shifts, and it should be used when the market is trending. If you use this indicator for a short timeframe, chances are, you will get several false signals. Scalpers do not favor this, however, due to the noise it generates.
