Introduction
The Elder’s Three Screen Strategy is a mechanism that traders can use to examine the market (forex/securities), usually in three phases. Each phase involves using a single indicator to determine the market trend’s direction and whether the market is overbought or oversold. For a trade formation to provide a valid signal, there must be a confirmation in all the three phases.
The Three Screens Strategy for forex trading is popularly known by its other name, the Triple Screen Trading System. Dr. Alexander Elder conceptualized this trading system in 1985, but it was not until April of 1986 that Elder expounded on the strategy in the month’s issue of Futures Magazine.
What could have triggered Elder to conceive such a seemingly complex trading system? Like any other professional trader, Elder had experienced the insufficiency of a single indicator. One indicator often serves a trader well, but before long, it begins to give off a string of wrong signals. Elder, therefore, understood that no indicator is capable of flawlessly interpreting or predicting the market.
According to his analysis, Elder discovered that using three indicators in stages increased the probability of profitable trades. Because he found himself looking at three screens every other time when using the mechanism, he called it the “Triple Screens” strategy.
How do you choose indicators when using this strategy?
The Elder explained that it is best to mix trend indicators and oscillators when expounding on the trading system. The trend indicators should help you follow the trending market trend while the oscillators are great for counter-trend methods, especially when the market is range-bound.
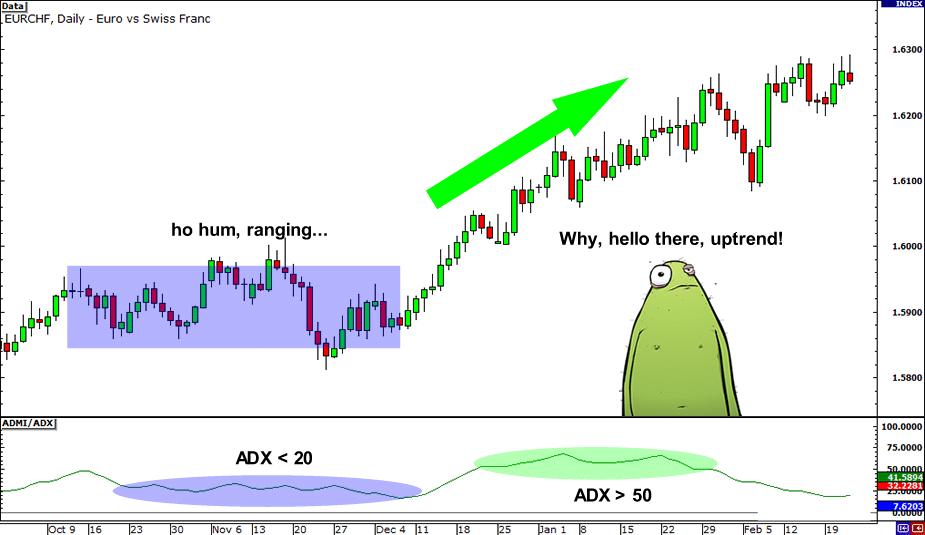
Elder’s reasoning was simple. When carrying out technical analysis, trend-following indicators are a perfect fit when the market is trending. An indicator like the average directional movement index (ADX) tells you the direction of the trend and its strength. The ADX reading is greater than 50 in an uptrending market. It is less than 20 in a range-bound market, as shown in the figure below.

In a ranging market, oscillators perform best. Although range-bound markets do not follow a definitive direction, an oscillator would still show if the financial instrument in question is overbought or oversold. In this light, it was clear to Elder that a mix of trend-following indicators and oscillators was best suited to give traders the most probable trade confirmation.
Choosing appropriate timeframes and market trends
Time is another crucial aspect of the Three Screens Strategy. Another one of Elder’s gems while presenting the trading strategy to traders is how to select appropriate time frames for the best outcome. Although Elder did not insist on a particular line up of charts, traders have come to arrange the three screens in a ratio of 3:4:5.
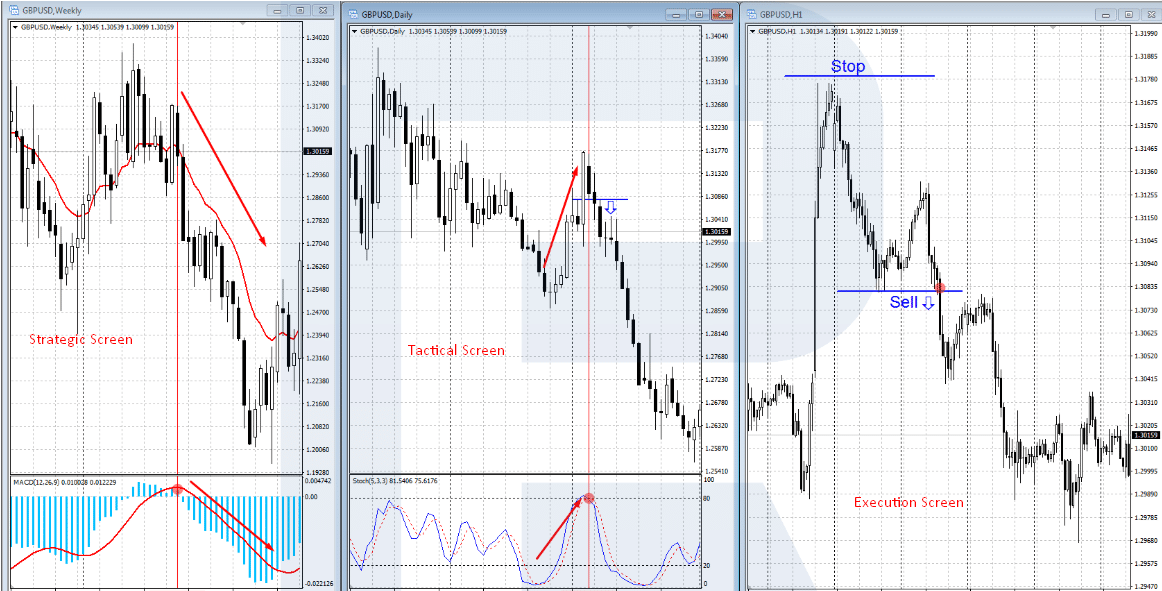
Over time, this ratio has become prominent and has gained a considerable fanbase. But why? Continued refining of the Three Screens Strategy led to traders giving labels to each of the three screens. The first screen – which includes the first technical indicator – is called the “Strategic Screen.” This screen also has the longest time frame.
The second screen is the “Tactical Screen.” This screen lies between the first and third screen in terms of timeframe. Its timeframe is shorter than the first screen but longer than that for the third screen. The third screen is called the “Executional Screen.” The price action movement in this screen is more sensitive, and the chart more rugged because of the shorter time frame in consideration.

How does the ratio help you to determine the time frames of each screen? When considering timeframes, the timeframe for the Strategic Screen is the most important. Also, selecting the timeframe for the Strategic Screen will depend on the kind of trade you would like to make. If you are a position trader, then the long-term trend is most suitable for you. Traders call this a long-range triple screen style. Another name for this triple screen style is the tide.
For the long-range triple screen style, the timeframe most often considered for the Strategic Screen is weekly. Using the 3:4:5 ratio, it means you will divide the weekly timeframe for Strategic Screen by 5 to get the timeframe for the Tactical Screen, which is Daily. For the Execution Screen’s timeframe, divide the preceding timeframe by five, which yields a 4-hour chart (timeframe).
On the other hand, short-term traders – especially day traders – need to consider short-term trends. It means the timeframe for the Strategic Screen should not go beyond a few hours. If you selected a 4-hour timeframe for the Strategy Screen, then the timeframe for Tactical and Execution Screens will be 1 hour and 15 minutes, respectively. Remember, 3:4:5!
What happens when – after calculations – the exact time frame does not exist on the trading platform you are using? In this case, pick the chart period; this is closest to your calculated timeframe. If, for instance, you find the timeframe for the Execution Screen is 20 minutes, then pick the 30 minutes chart because 20 minutes is closer to 30 minutes than 15 minutes or 1 hour.
PART 2
How the Three Screens Strategy works
You will understand this section better if you take some time and refresh your memory about selecting timeframes and how it interplays with market trends. But for the sake of convenience, let us revisit the concept here.
A triple screen style could be long-range, medium-range, or short-range. Each range is useful depending on whether you are a position trader or a day trader. The long-range style (long-term trend) is also called tide, the medium-range style (intermediate trend) is the wave, while the short-range style (short-term trend) is the ripple.
Originally, Elder designed the strategy such that the wave is the setup which you should aim to trade. As such, Elder’s default trading timeframe for the Strategic Screen was daily. But as you saw earlier, if the Strategic Screen is a daily period chart, then the Execution Screen should be a 1-hour chart.
Illustration: Here is how you read the screens
Consider the EUR/USD market. To use the Three Screens Strategy, we will consider three screens of the EUR/USD chart, each with a different indicator and different timeframe. This illustration will use the weekly timeframe for the tide, daily timeframe for wave, and 4-hour timeframe for ripple.
First Screen: Market Tide
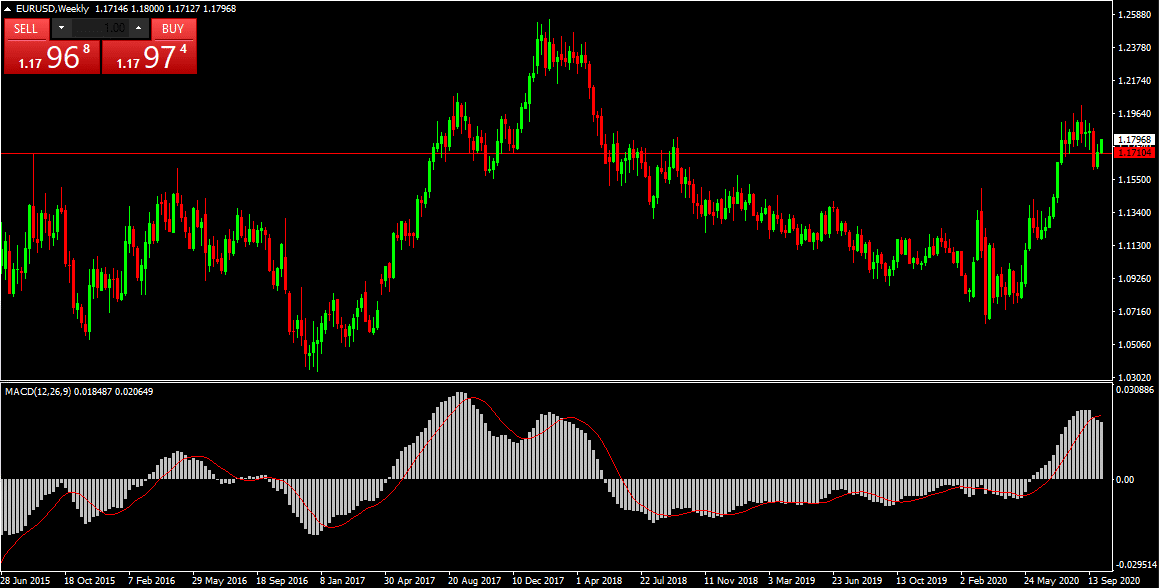
In this screen, we will use a trend-following indicator because of the longer timeframe. A suitable indicator is the MACD. Why? The indicator is suitable for finding trends and identifying whether they are bearish or bullish. The figure below shows how our first screen appears when MACD is activated:

The MACD appears below the price chart (weekly period chart). As you can see, the indicator is telling us that the market is uptrending, but the trend is declining. If the MACD histogram crosses the 0.00 line (or the pivot- or center-line), then a key sell signal would be outputted.
Second Screen: Market Wave
For this screen, we shall use the daily timeframe. Remember the 3:4:5 ratio? On this screen, we will apply an oscillator to the price chart. The oscillator has only one task: to confirm market entry points, whether you want to buy or sell. In this case, we will use the Stochastic oscillator.
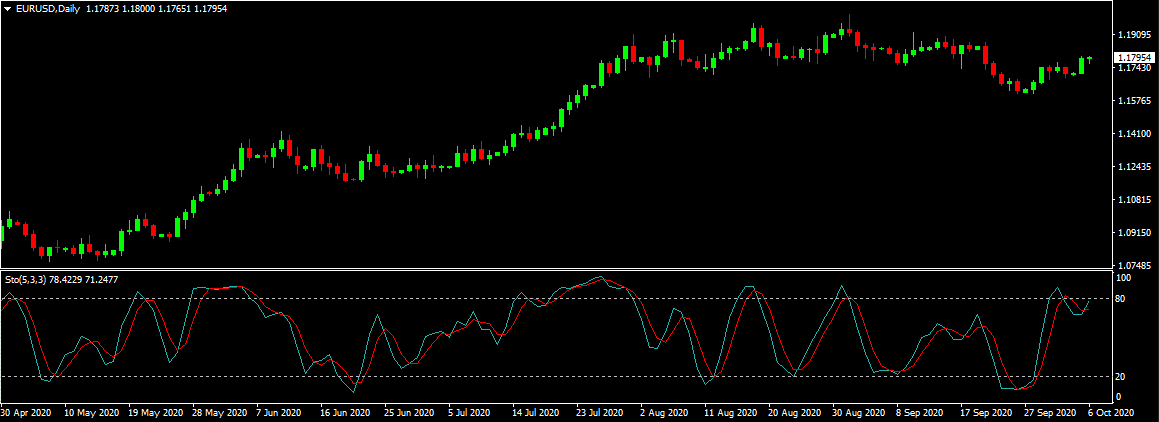
If you take another look at the First Screen, you will notice that the trend was declining in late September but began rising in October. For this reason, we will only focus on October in the Second Screen when looking for buy/sell price points.

As it is clear, the Stochastic oscillator shows that the EURUSD market was overbought in late September but began to change direction in October. However, the indicator indicates that the bulls are still in control of the market. If you take a closer look at the two screens, you will notice that the weekly trend is falling while the daily trend is increasing. It brings us to the Third Screen.
Third Screen: Market Ripple
Usually, you are not required to create a chart for this screen because the task here is to execute the signals from the first two screens. However, you should note that this screen is essential for setting up the trailing stop for your trade. The trailing stop technique usually activates when the weekly price action is climbing while the daily price is falling.
In our case, the weekly price action seems to be declining while the daily price action is climbing. Here, the trick is to go short, but ensure that you protect your position by setting up a trailing sell stop. Advisably, use a tight trailing sell stop to manage your risk better.
To better understand how to read the signals from the First and Second Screens and how to react, consider the table below:
Triple Screen Entry Rules
| First Screen (Strategic Chart) | Second Screen (Tactical Chart) | Action (Executional Chart) | Action |
| Up | Down | Up | Go long |
| Up | Up | Up/Down | Wait |
| Down | Up | Down | Go short |
| Down | Down | Up/Down | Wait |
Faults in the Three Screens Strategy
Elder’s motivation for developing the Three Screens Strategy was to increase technical indicators’ capability to interpret the market better and for longer. Because different indicators might give off conflicting signals, Elder deemed it fit to consider at least three perspectives of a trade set up before settling on the signal.
Previously, we saw how you could select indicators for building up the Three Screens Strategy. We noted that Elder favored trend-following indicators and oscillators to create the three screens if you can recall. For keen readers, one can already see an inherent problem herein that might misfire the strategy.
As we said, Elder wanted to deal with the problem of flawed signals produced by a single indicator. But, as you can see, this strategy is considering just two types of indicators, trend-following, and oscillators. What the indicators are capable of, they cannot solve the problem of flawed signals entirely.
The trend is the most traded setup in forex, and everywhere else. It is why technical indicators like exponential moving average (EMA) and Moving Average Convergence Divergence (MACD) are very commonplace. For the few traders who use oscillators for confirmation, you will mostly find them relying on the relative strength index (RSI) to do the job.
Over reliance on just two types of indicators signifies trouble. In the first place, you are unlikely to have a comprehensive view of the market, which means the signals received could misfire. Secondly, you are unlikely to develop an edge in the market – which is the crux of strategies like Three Screens – because many traders rely on the same strategy like you could be getting the same signal. So, your trade might end up in a pile of orders, hence diminishing the trade setup’s profitability.
Another fault in the Three Screens Strategy is the possibility of never getting a confirmation for your trade setup. Recall in the first section of this article, we spoke about different indicators giving different signals for the same financial instrument and in the same chart period. Now, consider a case where each of the screens’ indicators produces different signals. Although this happens, what if the signals you select do not output a positive interpretation of the market, however much you try?
In short, you run the risk of running around in endless circles when using the Three Screens Strategy. But trading – whether it is forex or securities – is a time-sensitive affair, especially if you are a day trader. In this case, you are better off if you do exhaustive prior research, especially on signals whose likelihood of contradicting each other is low. Armed with this information, you should breeze through setting up trades with this strategy.
Closing thoughts
Whether you are a position trader or a day trader, this trading strategy requires that you examine the market from the long-term trend to the short-term trend (from the tide to the ripple). This way, you can gain a comprehensive view of the market. Note: always start examining the market from the tide and finish with the ripple.
