Commodity Channel Index (CCI) and how it finds the irregular
The CCI indicator belongs to the group of momentum and trend-following indicators. Traders can use CCI on multiple timeframes to filter out false signals. The formula of CCI includes the Mean Deviation. The idea behind the indicator is when the price data deviates from the Mean too much and stays there – that signals something “not standard” is happening in the market.
Here is the formula of CCI:
(Typical Price – Simple Moving Average) / (0.015 x Mean Deviation)
Typical price is the average of High, Low and Close of the selected period.
From the mathematical viewpoint, the “not standard” prolonged course of events happens about 25% of the time. From a trader’s viewpoint, the “not standard” course of events that is supposed to happen 25% of the time but keeps happening is called a trend!
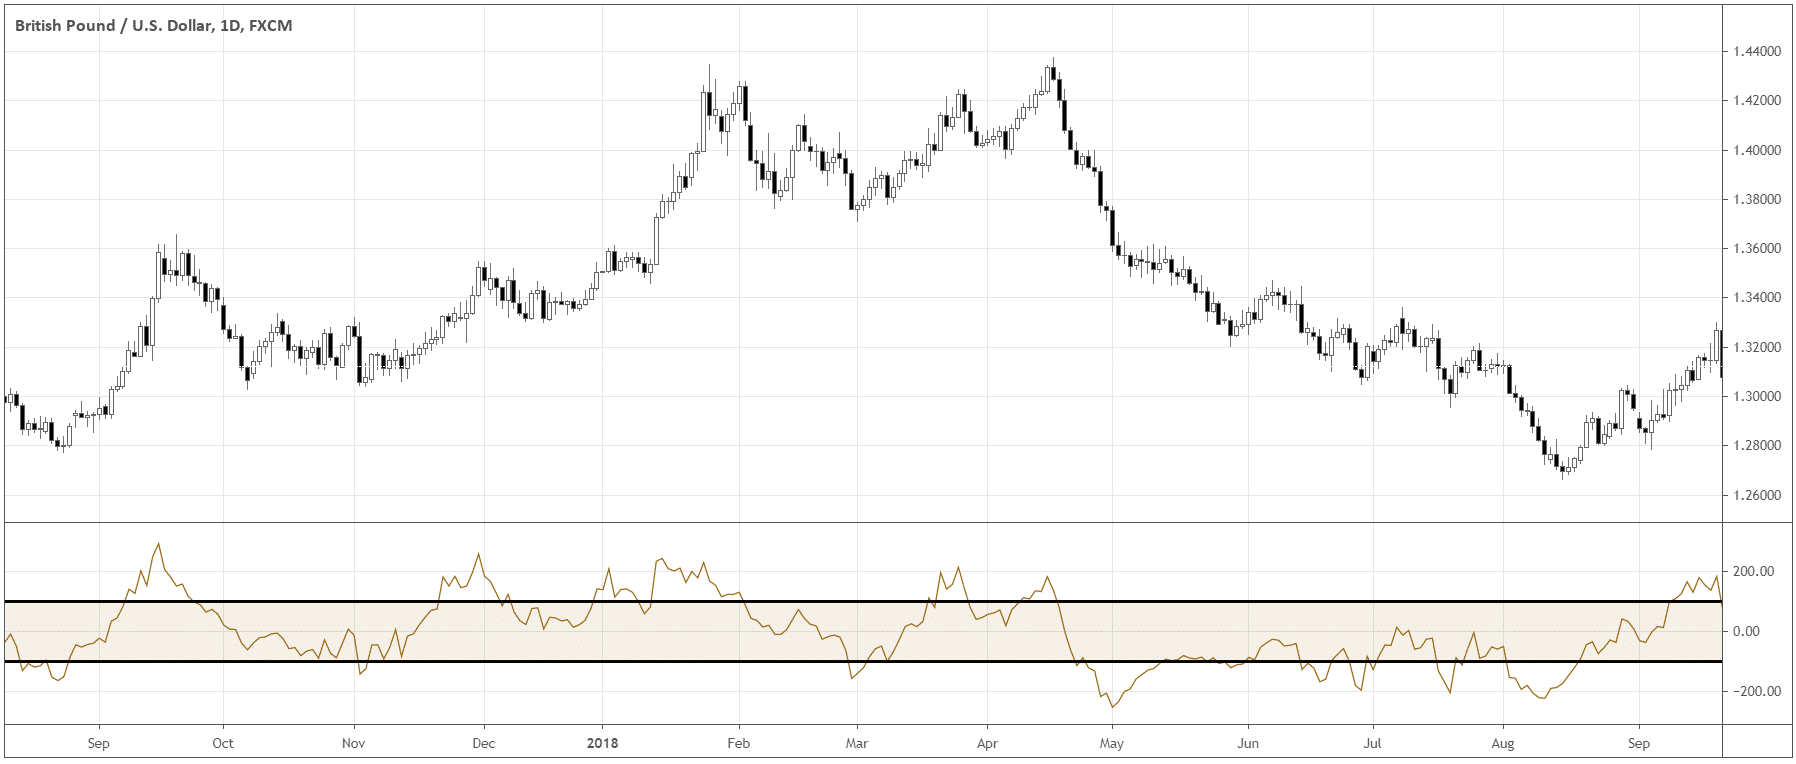
The indicator stays 75% of the time between -100 and 100. When CCI goes above 100, it signals a strength and possible uptrend. When CCI declines below -100, it’s a signal of weakness, and the bearish trend might be in place. The most common periods are 20, 30 and 40. Short -term and long-term traders use different periods and timeframes according to their trading style.

What makes CCI work
The CCI was developed in 1980 by a mathematician Donald Lambert. Initially, Lambert intended the indicator to be used in commodity markets. The purpose of developing the indicator was to find effective timing techniques to enter the seasonal commodity markets.
Lambert developed a specific method of comparing the current price fluctuations with the past price data.
CCI is based on two principles:
- Moving Average – the values of a moving average are used as a benchmark to compare past price action with the current one. The comparison helps to smoothen the historical price data and to avoid the distortions caused by market noise.
- Standardization – Financial assets usually have their special cycles of movement. The principle of standardization aligns CCI values with the frequencies of market cycles. In the equation of CCI, Lambert used 0.015 as the optimal constant divisor value. The specific constant value of 0.015 makes the calculations of the indicator 70-80% of the time fall in the range of +100 and -100. This principle resembles the nature of the changes in the market environment – 70-80% of the time markets are ranging, and 20-30% markets are trending.
Approaches of trading with CCI
Timeframes and CCI
We can use different timeframes of the indicator to filter out only the best quality setups.
For example, if CCI stays above +100 on the daily chart, we would only consider buy signals on the one-hour chart. In the same way, if CCI is below -100 on the daily chart, we would look for only short-sell signals on the one-hour timeframe.
Approach the market in multiple ways with CCI
There are different approaches to interpreting and applying CCI. Sometimes the logic of entries is quite a contrast.
Below are popular principles of CCI application:
- Breakout: If CCI goes beyond the range of -100 to 100 in either direction, then the indicator signals the breakout of the range with the increasing momentum. In this case, the strategy would be to follow the direction of the momentum. When CCI returns to the values within the -100 and 100 range, we should close the position. The return to the range is the signal of the market trying to find its “mean value”. On the chart, it would look like consolidation or correction.
- Market Reversal: CCI can be used to trade move reversals. After CCI moves beyond the +100 and -100 range, we can open a contrarian trade to bet on the return to the normal range.
- Continuation: When CCI reaches particularly extreme positive or negative values, it can be a signal of further move continuation.
- Divergence: Like many other popular indicators, CCI can give signals of trend weakening through divergence with the price. For example, if the price makes new highs, but CCI keeps making lower highs, then the trend is losing momentum, and the possible reversal is near.
The limitations of CCI
The market continuously changes from normal to extremes. The CCI indicator attempts to track this cycle from the mathematical point of view and that is what makes it work under normal conditions. However, not all kinds of price action can be smoothed away by a mathematical formula. In volatile, choppy markets CCI will give many false signals. The proper stop-loss strategy must be employed along with the signals from the indicator to be profitable in the long-term.
CCI basic trading signals
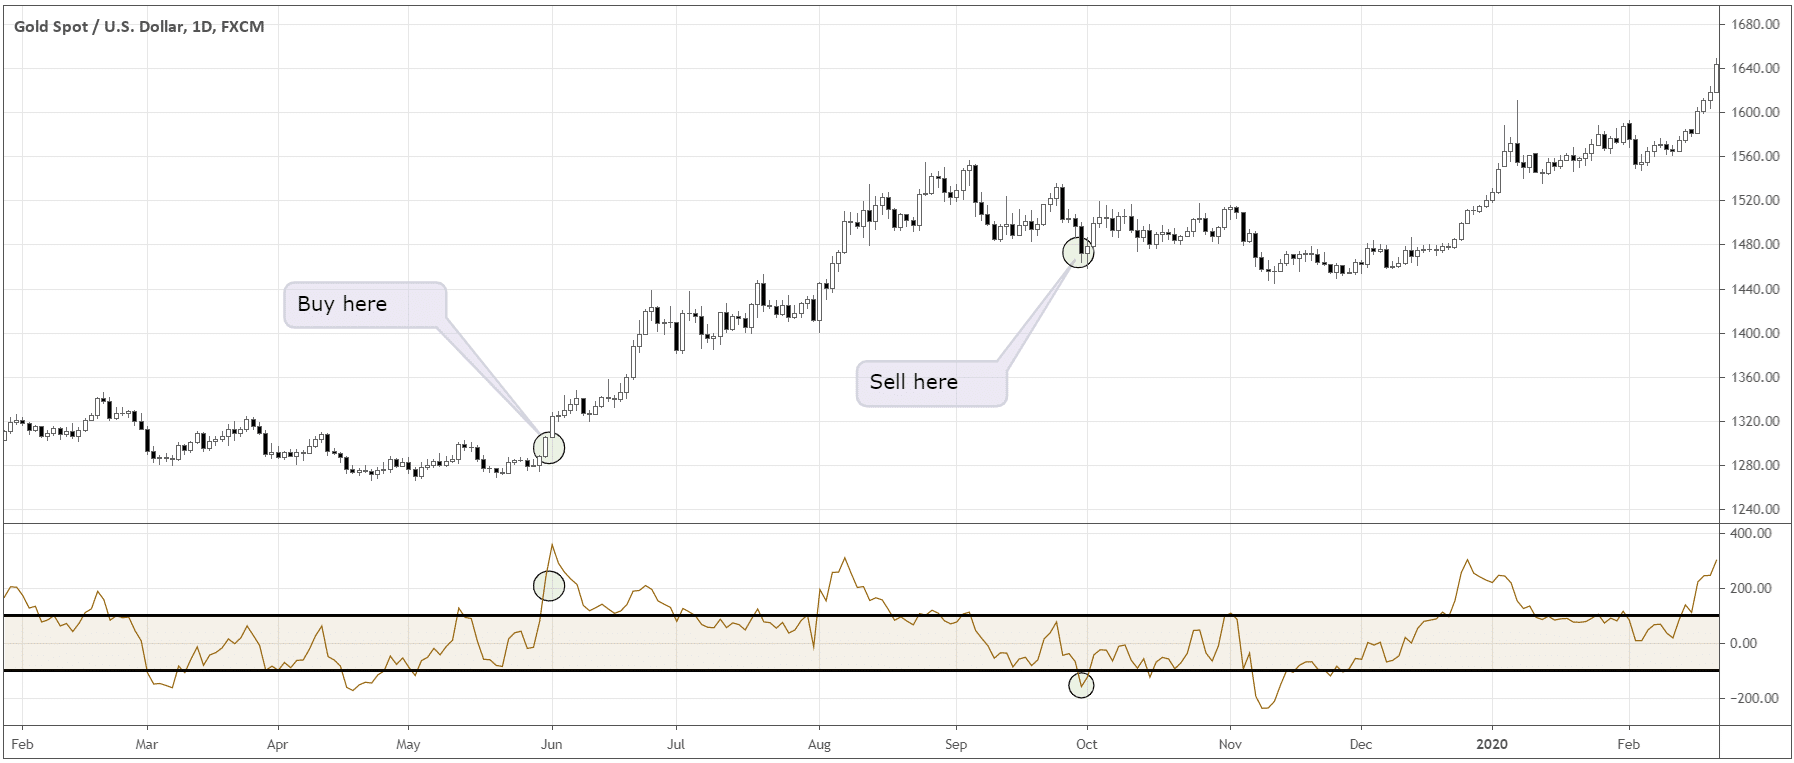
The simplest CCI strategy would fit medium to long-term investors. Investors can buy when CCI goes above +100 and sell only when the indicator goes below -100. Every time CCI comes back to the values above +100, the investors can reenter the market or add to their positions. Vice-versa applies for the short-sell trades.

Short-term traders can also use these signals; however, they should take care of the more flexible system of exits. From the chart above we can see that exiting when CCI dips below -100 would not be an option for short-term traders, as that would cause tangible drawdowns.
Short-term trading techniques
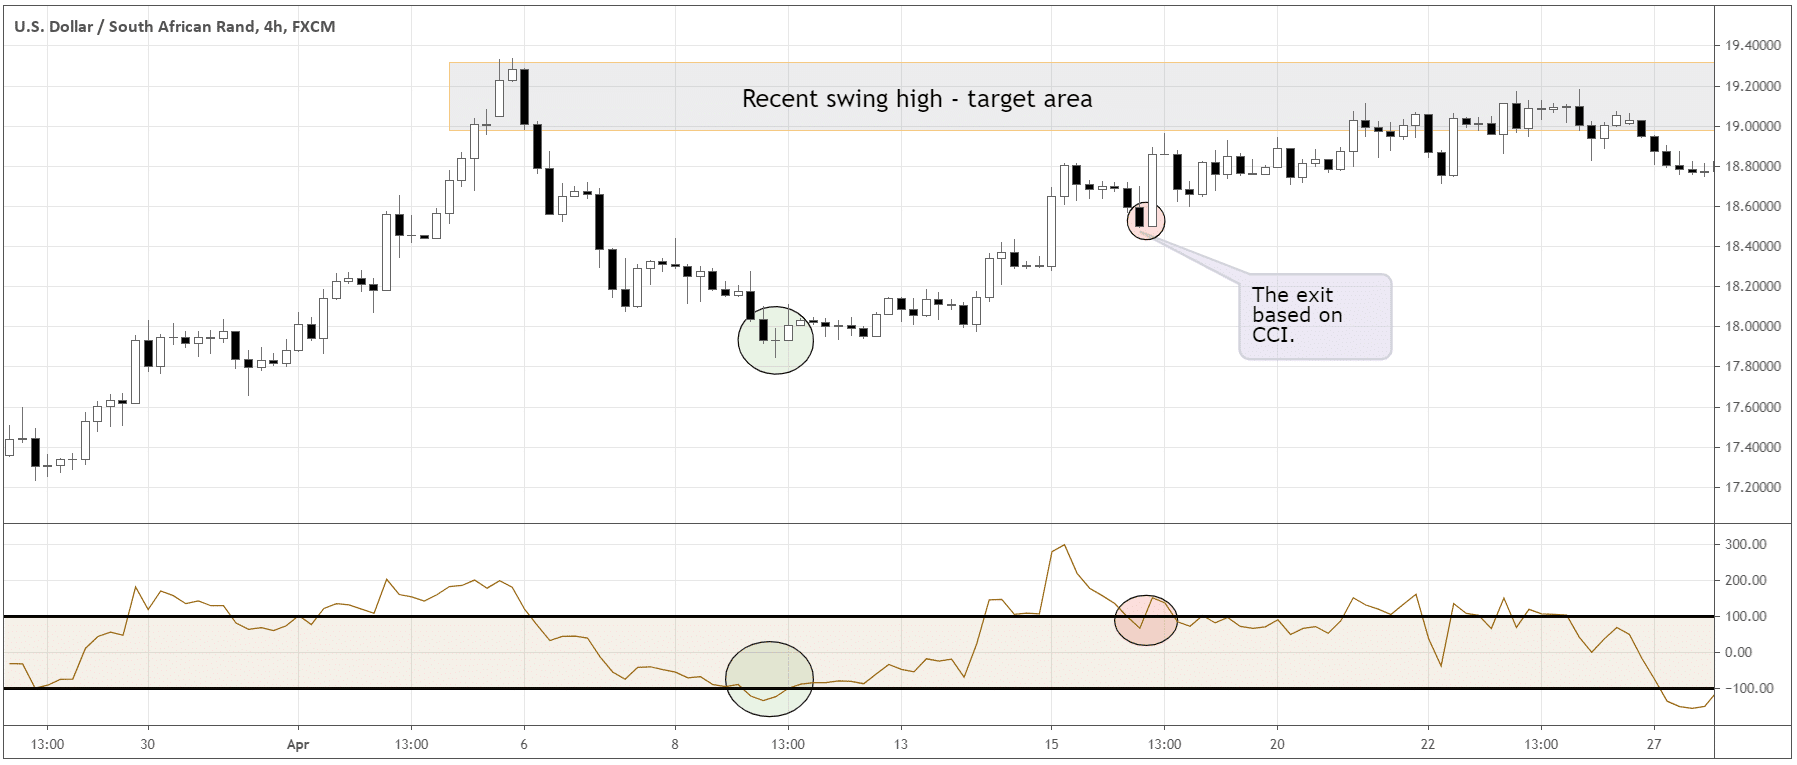
Swing traders like to buy dips of the short-term trends and exit near the swing highs in case of an uptrend. CCI can help with identifying such entries and exits. After CCI goes below -100, traders can buy once CCI crosses -100 from below. The exit of the trade will be around the recent swing highs. The position can also be closed when CCI crosses +100 value and then drops down below +100 (see the chart below). For short-sell trades the vice-versa is applicable.

We can get another kind of exit if CCI dips below -100 on the longer time frame.
You should adjust the rules of the entries and exits with CCI for the particular market you’re trading. You can buy when CCI crosses zero from below, so you’re sure that the pullback is over. Later on, you can exit after CCI rallies above +100 and dips below zero instead of +100. In this way, you can catch bigger moves in a strong trend.
Final Thoughts
The idea behind the CCI indicator is elegant – we seek for the times when things get extreme and vice versa. CCI is a great tool to ride trends in different ways. The indicator can generate the rebound-type signals and the breakout-type signals. We can also get profit taking signals with CCI. However, CCI doesn’t provide the signals to exit losing trades, the tools such as stop-loss based on price action, volatility stops or others must be applied to protect the capital.
