In the 1980s, the working assumption was that volatility was a static quality of a financial asset. To that end, traders commonly utilized percentage bands to create price envelopes and predict trade opportunities. However, one John Bollinger, on close observation, discovered that volatility was constantly changing, and therefore, the tool they had previously sworn by was inherently flawed. This led him to develop the Bollinger Bands (BB), which are still in use today.
Defining Bollinger Bands
At its core, the BB is a volatility indicator. This means that it measures the relative highs and lows of a financial asset’s price as they relate to previous price levels. The most appropriate measure of volatility is standard deviation, which varies in line with changes in volatility.
To that end, John used a Simple Moving Average to obtain an average of prices, which he used as his indicator’s middle band. The default number of periods used is 20, but one can always adjust this number to better fit their strategy. From this MA, he added an upper and lower band, both equidistant from it. The distance between them he set at 2 standard deviations away from the middle band in either direction. Again, you can always adjust the number of standard deviations to narrow or widen the distance between the bands.
Trading the BB
1. Uptrends
This tool can be used to identify rallies as they form, as well as gauge the momentum behind them. Characteristically, during an uptrend, prices tend to hug or touch the upper band quite often. Since price charts are marked by fluctuations, it is not uncommon to see corrections manifest in the middle of a strong trend. During an uptrend, if any price pullbacks are reversed before they cross below the middle band, it indicates that the rally is a strong one. Therefore, that would be an uptrend worth trading.
Conversely, if the market correction manages to surpass the middle band, and worse still, go as far as the lower band, that tells us that the rally is losing momentum. This could be a sign of an incoming bearish reversal, and thus we should exit all long positions at this point.

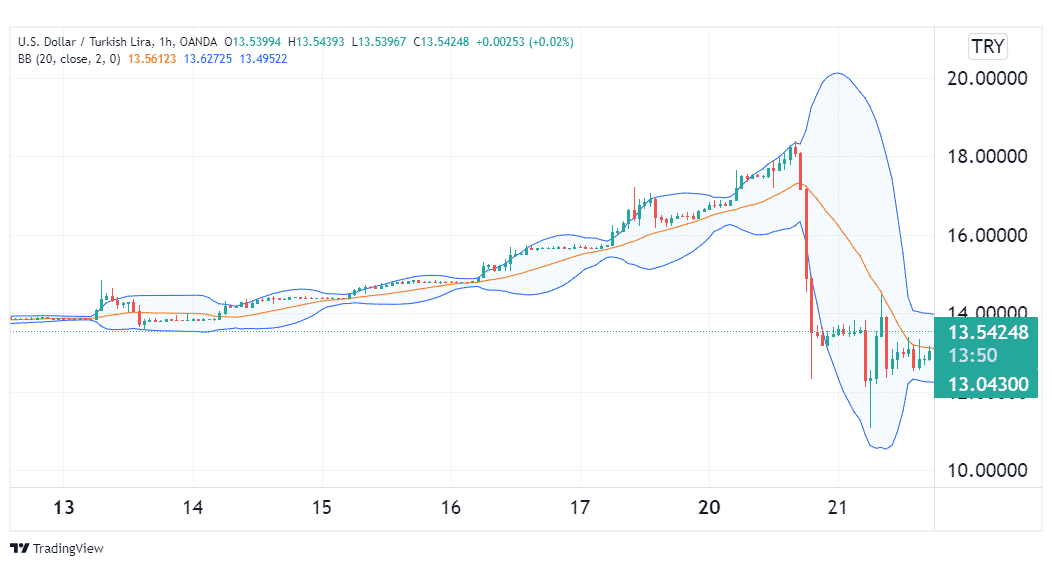
The image above shows the USDTRY pair in a strong uptrend. Observe how all price pullbacks during the rally bounce off of the middle band. Also, you can see that when the middle band was breached, it marked the beginning of a strong trend reversal.
2. Downtrends
In a similar manner, the BB can be used to point out downtrends as they happen, and give us an idea of how much momentum lies behind such a move. Usually, during a downtrend, prices will constantly touch the lower band, sometimes even crossing it. Failure to do this may indicate waning momentum behind the trend.
If any pullbacks happen never to surpass the middle band but instead are reversed quickly back to the lower band, it points to a very strong price decline. If, instead, these pullbacks cross above the middle band or touch the upper band, this could well be a sign of an impending reversal to the upside.
Typically, most traders will avoid trading downtrends. However, if you’re brave enough to do so, remember to watch out for any market correction that surpasses the middle band.

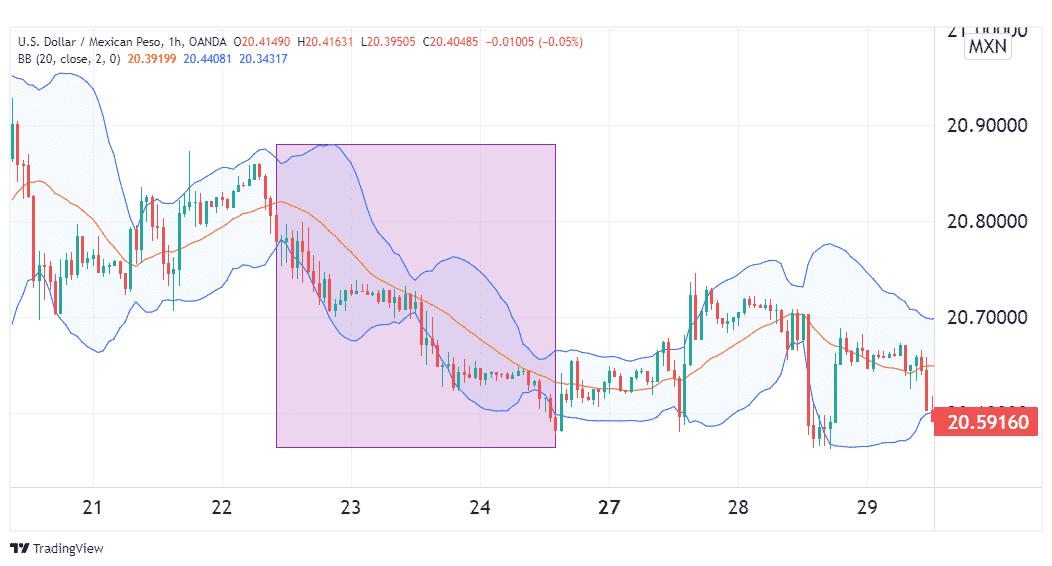
In the illustration above, we see the US dollar decline against the Peso in the highlighted area. During the decline, any corrections did not surpass the middle band. When they finally did cross it, the pair went on a rally, marking the exit for any open short trades on the pair.
3. BB squeezes
We’ve established that the standard deviation that separates the outer bands from the MA line changes with fluctuations in volatility. Thus, when volatility increases, the distance between the band widens. Similarly, these bands will narrow or squeeze whenever the volatility reduces.
Narrowed bands point to a market in consolidation. This consolidation phase means that a breakout is imminent, which could present traders with the opportunity for profit, regardless of which direction the breakout follows. An upward breakout would adhere to the BB’s upper band, while a downward breakout would hug the lower band.

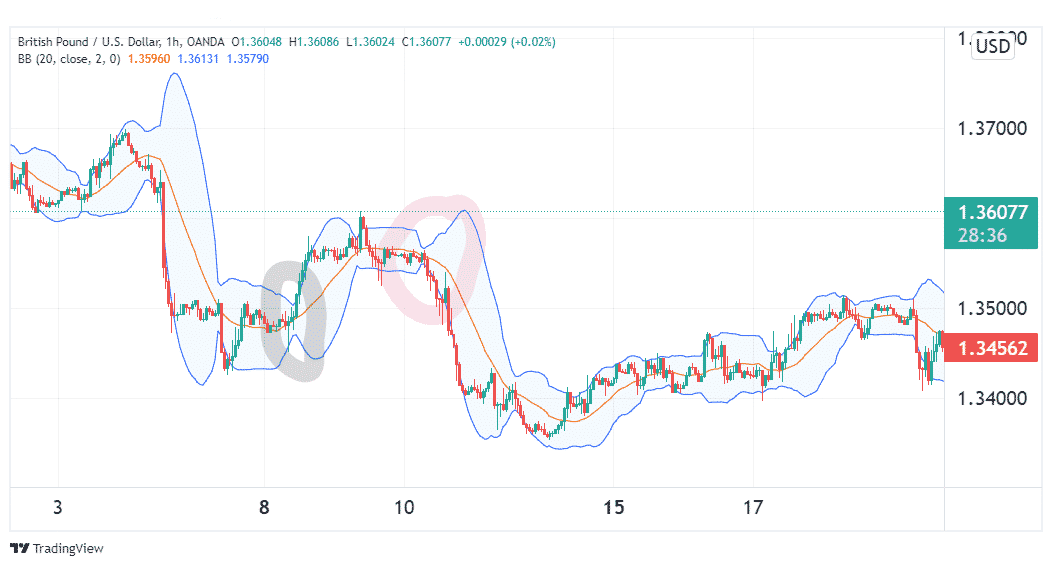
The image above shows two squeezes in the highlighted sections. The first squeeze preceded a bullish breakout, while the second preceded an even bigger breakout to the downside. Once you spot a squeeze, you can place two pending orders, one at each outer band, and wait for the breakout to activate one of the orders. Once that’s done, remember to close the other order to prevent unnecessary loss.
Limitations of the BB
The creation of this tool begins with an SMA, which is lagging, making the BB lagging too, which means it is not sufficient by its lonesome to predict the direction. For that reason, one should couple this instrument with other non-correlated tools which can provide signal confirmation.
What’s more, the default settings on most charting platforms won’t work for all traders. The onus is on you to find the ideal settings for your strategy, so take time to test the indicator to find out which settings work best.
Conclusion
The BB was developed to produce a more accurate measure of volatility than percentage bands, its predecessor. Using standard deviation, it utilizes price envelops to highlight market trends or lack thereof, as well as the momentum behind price movements. Prices are in an uptrend when they tend to continually hit the upper band, while prices in a downtrend will frequently touch the lower band. Usually, before a large price move happens, these bands will squeeze together. Thus, breakout traders can take squeezes as a sign of incoming volatility, and position their trades appropriately to take advantage of this.
