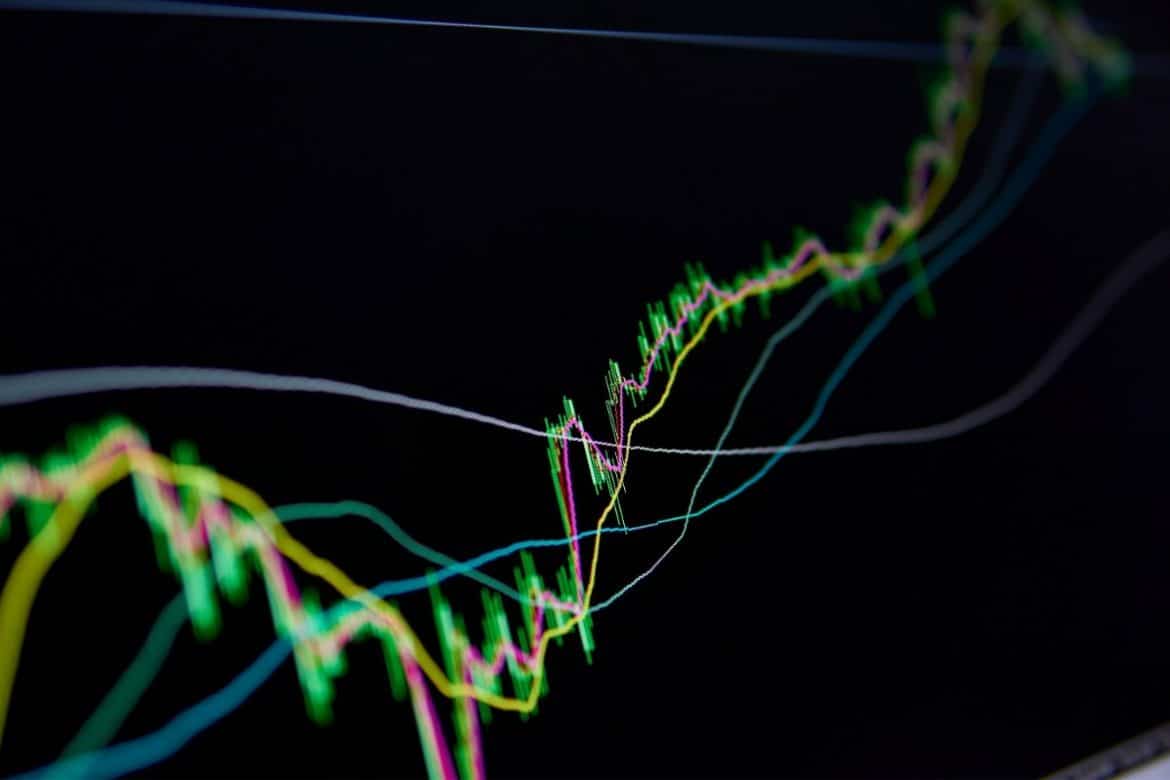
This is the study of price action through pattern recognition and indicators in order to forecast future price action. There is no 100 percent that price will move as what the technical analysis forecast. That is why trading is a probability game and successful application of technical analysis alerts the trader to the highest probability move.
Technical analysis is only valuable if the person using it is disciplined. One common mistakes many traders made while using technical analysis is often not testing a strategy long enough to see the whole picture but hastily changing the trading style because of a few bad trades.
Technical analysis includes charting and technical indicators. There are many ways to analyse the markets with technical analysis. I will be covering them briefly because I believe you can get much more information from babypips.com.
Technical analysis works on the basis that past market action tends to repeat itself. The key is to study history and through price pattern attempt to forecast future price action. As the markets are man made product, human psychology is the force behind every market move. Repetition will remain as long as markets are a result of human interaction.
Let examine some charting patterns.
Trend line
There are many ways of drawing trend lines and hence there isn’t any correct method to draw trend lines. The purpose of drawing trend lines is to identify potential support and resistance.
Support is an area below the market price where buying overcomes selling. Resistance is an area above the market price where selling overcomes buying.
Support and resistance should be viewed as a zone, not a point. If properly identified, the zones and be used to trade the following patterns:
Support and Resistance Channel Trading Channel Breakout Pattern Recognition
Technical Indicators
There are 2 types of technical indicators.
Trending Indicators
This type of indicator performs very well when market is trending. It is lagging in nature. It will give false or no signal when market is either consolidating or ranging.
Moving Average Average True Range ADX Bollinger Band
Oscillator
This type of indicator performs very well when market is either consolidating or range bound. It signaled to the trader if price is overbought or oversold. It will give many false signals when market is trending.
RSI Stochastics MACD
It is very important that a trader understands what are the market conditions and use the respective technical indicators to generate signals. I have yet to find the best indicator that can consistently generate accurate signals in all types of market conditions. The key is applying the right tool at the right time, and trade with discipline.
Other Technical Analysis
Gann Theory Fibonacci Retracement and Extension Elliot Wave Theory
For information on how to use these indicators, I will strongly recommend that you visit babypips.com. They provide comprehensive collections of technical indicators.
