To get better at trading, you must research, study, and learn about as many trading approaches as you can. Only then, you will be able to adapt and incorporate the ones that will be best for you. The deviation is one of the top seven indicator setups you should know about.
There are many ways to measure if a currency is oversold or overbought. While looking into it, you need to use metrics consistent with your trading time horizon. For instance, if you are into short-term trading, then looking for oversold and overbought signals on a weekly chart is not useful for you.
Oversold And Overbought Measure
To match our time horizon, we look at a simple yet effective oversold and overbought measure. It is how far away spot is from the 100hour moving average. You can call this deviation from the 100hour or simply the deviation. We may use it as a nice back of the envelope overshoot warning system.If you notice overbought and oversold trading, you must understand that by definition, you are going against a strong trend. Overbought things can get even more overbought and it is similar to oversold things as well. So, no matter how crazy a move you are looking at, it can always get even crazier.
When it comes to overbought and oversold things, if things do beyond the normal range you are used to, the first thing you should do is ask yourself the reason behind it before going the other way reflexively. Keep in mind that sometimes, there has to be a clear reason behind the extreme trending behaviour. You should never ignore a valid reason. However, when there is no strong fundamental reason behind the move, you should fade the oversold and overbought markets. Look at the example below to understand the use of deviation as a tool.
USD CAD Example
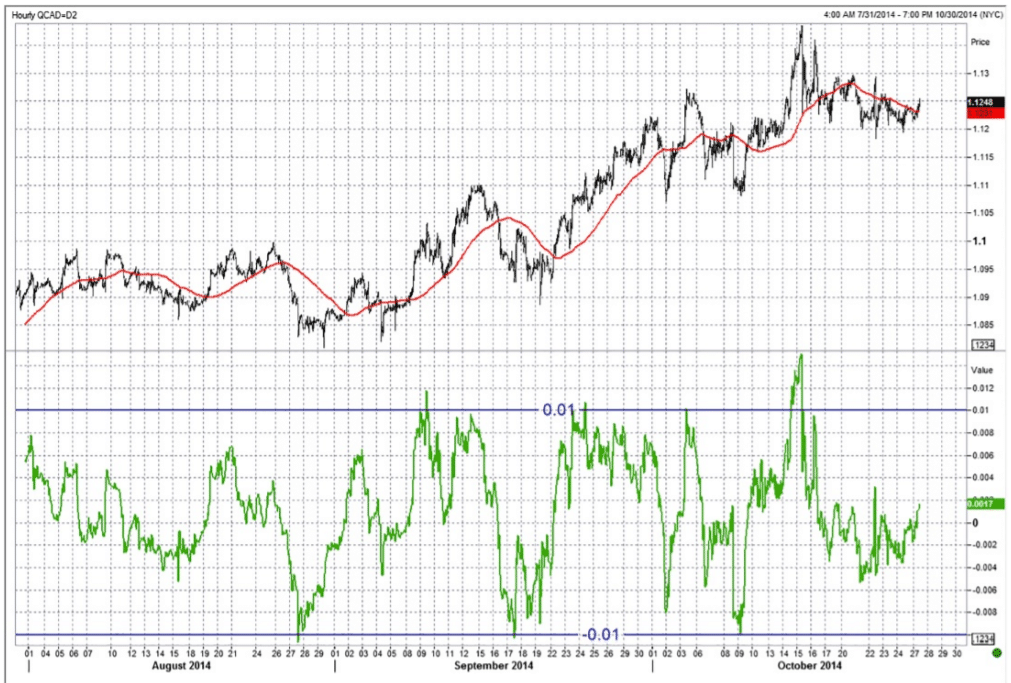
USDCAD is a currency pair popular for mean reversion. Hence, it is well suited to strategies that hunt for overbought and oversold conditions. When you trade USDCAD, you have to monitor how far it is trading from the 100hour MA constantly. Take a look at the chart below that represents hourly USDCAD with 100hour MA. You can see the deviation from the 100hour moving average. It took place on and from July 31, 2014, to October 30, 2014.

You can see USDCAD hourly from the black bars. The 100hour MA is the line on the main chart. The line beneath the main chart shows the difference between the two. As the spot moves away from the 100hour further, it stretches more like a rubber band. If it keeps stretching like this, the elastic is likely to snap eventually.
In this example, you can notice that the line below the chart oscillates between +100 pips and -100 pips roughly. The extreme points depend on overall volatility but usually, anything over 1% away from the 100hour indicates that it overdid the USDCAD. So, when USDCAD is at 1.10, it means 110 pips. In the chart, you can see that USDCAD runs out of stream generally whenever the deviation touches 100/110 pips on either side.
Keeping a Track
Like any technical indicator, you can never use the deviation on its own for initiating a trade. However, if you are looking for getting into a short USDCAD trade already, you have to be on high alert for moments when the spot gets over 100 pips above the 100hour MA. You can also leave a resting order 100 pips above the 100hour when you cannot keep an eye on it.
The chart above is a great example where USDCAD spiked to 1.1400 and also took the deviation up to 140 pips. Then, just a few hours later, it crashed back down to 1.1220. Keep in mind that while trading the deviation, you are going against the prevailing short-term trend. So, not only you have to maintain discipline but you also need to be careful. It is usually wise to set your position at the time when the deviation touches 1%. After that, you can put your stop loss another 0.7% away to give it a lot of extra room to overshoot further.
While we observe that deviation tends to close when spot reverts to the mean, sometimes deviation also closes with spot going nowhere and over time, the moving average catches up. As a result, it relieves overbought or oversold conditions without generating any profitable trade. Keep in mind that the deviation is also a good indicator for taking profits on winning trades. If you are long USDCAD and it is rallying over 100 points away from the 100hour MA, you need to sell some out. Later, you can buy it back.
The Bottom line
The deviation from a moving average is useful in any time frame. For example, a chart that displays how far spot trades from the 100day or 200day MA, can give a useful reading or bigger picture oversold or overbought conditions. The only thing you need to do is making sure that you know your time horizon.
